This Google™ translation feature is provided for informational purposes only.
The New York State Office of the State Comptroller's website is provided in English. However, the "Google Translate" option may help you to read it in other languages.
Google Translate™ cannot translate all types of documents, and it may not give you an exact translation all the time. If you rely on information obtained from Google Translate™, you do so at your own risk.
The Office of the State Comptroller does not warrant, promise, assure or guarantee the accuracy of the translations provided. The State of New York, its officers, employees, and/or agents are not liable to you, or to third parties, for damages or losses of any kind arising out of, or in connection with, the use or performance of such information. These include, but are not limited to:
damages or losses caused by reliance upon the accuracy of any such information
damages incurred from the viewing, distributing, or copying of such materials
Because Google Translate™ is intellectual property owned by Google Inc., you must use Google Translate™ in accord with the Google license agreement, which includes potential liability for misuse: Google Terms of Service.
2017 Financial Condition Report For Fiscal Year Ended March 31, 2017
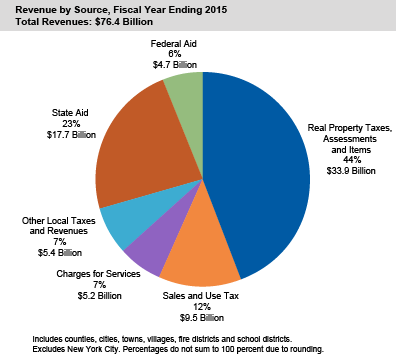
Real Property Taxes and Sales Taxes Are Major Local Revenue Sources
Real property taxes are the single largest source of local government revenue in the State, making up 44 percent of the total in 2015.
Some governments are even more dependent on the property tax for their revenues, including fire districts (94 percent), school districts (56 percent), towns (53 percent) and villages (49 percent).
Sales taxes are also an important revenue source (12 percent of total revenue) and the largest single revenue source for counties (33 percent). They are somewhat volatile, with strong growth in good economic times and declines in recessions.
Recently, growth in sales tax collections has slowed from about 5 percent per year (2011 through 2013) to around 3 percent per year (2014 through 2016). Growth in recent years has been particularly weak in upstate New York, but collections there rose somewhat faster in the first six months of 2017.
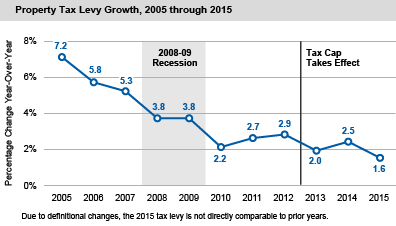
Property Tax Levy Growth Has Been Trending Lower
Annual increases in property tax levy have been below 3 percent since 2010, significantly less than pre-recession growth.
The Real Property Tax Levy Limit (commonly called the “tax cap”), was enacted in 2011 (for fiscal years beginning 2012) in an effort to temper growth in real property taxes.
Each local government’s tax cap calculation involves a multi-step formula, but generally the law limits levy increases to the lesser of 2 percent or the rate of inflation, with some exceptions. The law also includes provisions for a local government to override the tax cap.
Notably, inflation has been below 2 percent since late 2013, although it has been increasing again recently. Higher inflation will affect tax cap calculations for fiscal years beginning in 2018.
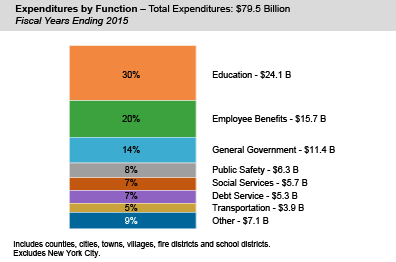
Education and Employee Benefits Account for Half of Local Government Expenditures
Education made up 30 percent of total local government expenditures for the 2015 fiscal year ($24.1 billion). Almost all of this is school district spending on primary and secondary education.
Employee benefits accounted for another 20 percent of local government spending ($15.7 billion). This is the fastest growing segment, increasing 5.2 percent annually over the 10 fiscal years ending 2015, compared to growth in other expenditures of 2.0 percent.
In 2016, counties had $24.1 billion in total expenditures, cities (not including New York City) had $5.0 billion, towns had $7.0 billion, villages had $3.0 billion, fire districts had $0.8 billion and school districts had $39.6 billion.
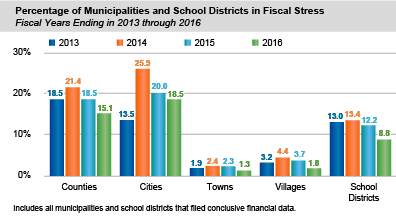
Fiscal Stress in Municipalities and School Districts Declined in 2016
The Office of the State Comptroller analyzes the financial condition of each municipality and school district through its Fiscal Stress Monitoring System, which combines a number of financial indicators into an overall score intended to measure entities’ budgetary solvency.
From 2013 through 2015, between 137 and 159 local governments and school districts (6.4 to 7.4 percent) were designated in a fiscal stress category. In 2016, the number declined to 97, or 4.6 percent.
In 2016, the municipalities most likely to be in fiscal stress were cities (18.5 percent) and counties (15.1 percent), while the least likely to be in fiscal stress were towns (1.3 percent) and villages (1.8 percent).
Only 8.8 percent of school districts were in fiscal stress in 2016, but they accounted for 59 of the 97 stressed entities.