

- Number of Employees Who Are Members
Generally, the more members there are on an employer’s payroll, the higher the employer’s annual payment is likely to be. The total number of billable (active) members as of fiscal year ended March 31, 2022 was 506,084. - Higher Salaries
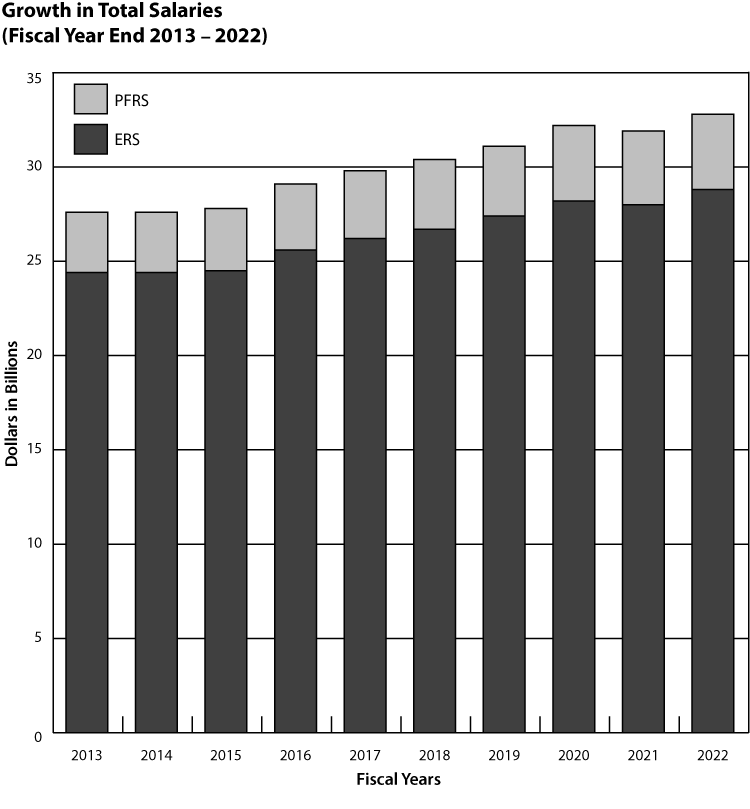
Employer rates are billed as a percentage of covered payroll. Higher salaries will increase an employer’s total bill. - Retirement Plans and Options Offered
Generally, choosing to offer your employees better retirement plans or benefit options results in a higher annual cost. Employers can also choose to offer improved retirement plans or optional benefits (for example, a one-year final average earnings for police officers and/or firefighters) to their employees. For example, if an employer chooses to provide a special plan for a specific employee group such as police officers or firefighters, the cost will be higher than a regular plan. A special plan allows for retirement after completing a specific number of years of credited service in specific job titles rather than attaining a certain age.
Rev. 2/23