
A robust, efficiently managed capital investment program can support healthy economic growth, while the deterioration of capital assets can weaken the State’s economy and its ability to attract and retain business. Capital assets include not only highways and bridges, but also facilities for education, government, health, housing, environmental conservation and recreation.
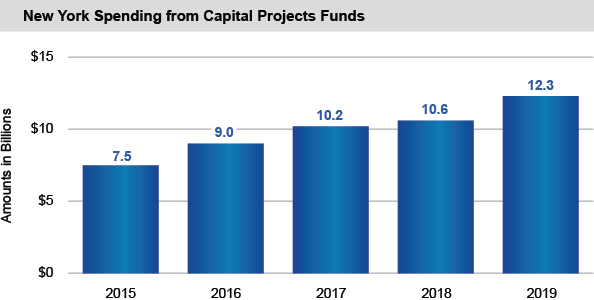
Capital Spending Has Increased Over the Past Five Years*
- From SFY 2014-15 to SFY 2018-19, capital spending increased by nearly $4.8 billion (62.5 percent). Spending increases within major categories included:
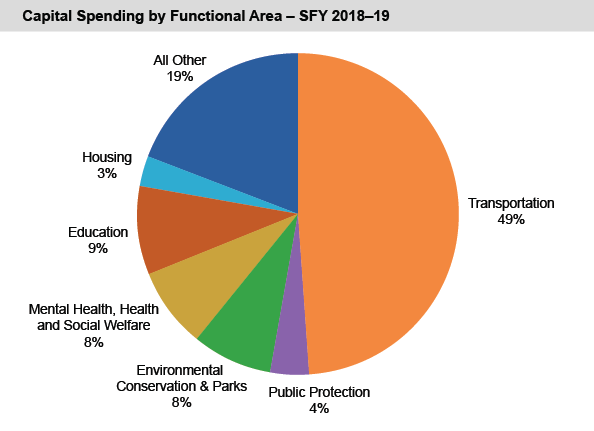
- Transportation, up by $1.5 billion (roughly 34 percent). Transportation accounted for just less than half of all capital projects spending in SFY 2018-19, down from 59 percent five years earlier.
- Environmental Conservation and Parks, which rose by $354 million (57.7 percent). This category’s share of total capital spending ticked down slightly from 8.1 percent to 7.9 percent.
- Mental Health, Health and Social Welfare purposes, up $553 million (138 percent).
- All other purposes, up by $1.6 billion (203.4 percent). The increase is largely attributable to:
- Certain economic development initiatives funded with State resources by the State’s public authorities in recent years; and
- Projects funded with extraordinary monetary settlement resources from the Dedicated Infrastructure Investment Fund. These included certain funding provided to the Thruway Authority for the Governor Mario M. Cuomo Bridge and other Thruway system improvements.
- Over the past 20 years, the State has financed an average of 35 percent of non-federal capital spending on a pay-as-you-go basis when including off-budget spending.
- Over the next five years, the Division of the Budget projects:
- Capital spending to average $13.4 billion per year; and
- The share of nonfederal capital spending financed on a pay-as-you-go basis to average 31.4 percent.
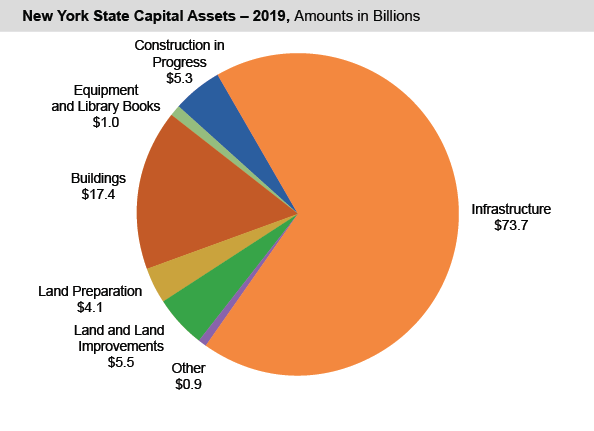
At the end of SFY 2018-19, the State reported $107.9 billion in capital assets, an increase of $1.7 billion (1.6 percent) over the prior year.
* Actual spending figures in this section do not include off-budget spending by public authorities funded directly from State-Supported bond proceeds, while figures for Division of the Budget projections include such spending.