Spending generally reflects the State’s program priorities. Comparing spending to revenue provides an indication of the State’s ability to support continuing programs. State spending, which includes spending from federal funds, is recorded on a cash basis.
See Appendices 1 and 2 for a breakdown of State spending by major service function and funding source for the past five years.
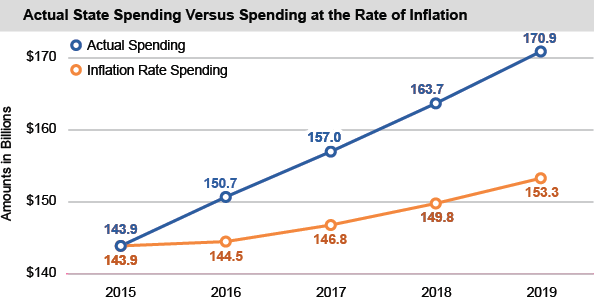
Growth in State Spending Has Exceeded the Rate of Inflation Over the Past Five Years
- Compared to the prior year, State spending increased $7.1 billion (4.4 percent) to $170.9 billion in 2019.
- Since 2015, the growth in State spending (18.8 percent) has exceeded the rate of inflation (Consumer Price Index increase of 6.5 percent).
- State spending has been partially paid for by borrowing $21.6 billion since 2015, including $6.7 billion in 2019.
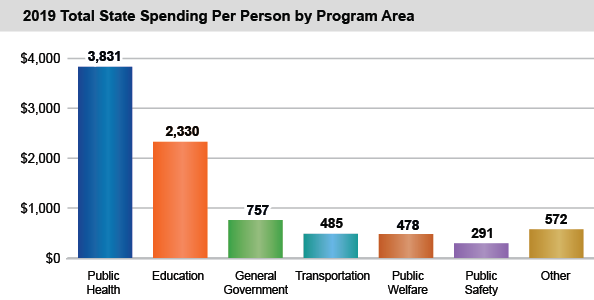
- In 2019, State spending was $8,744 per person.
- Spending on public health and education represents 70.5 percent of total State spending.