
New York City has added more than 900,000 jobs over the past ten years and its 24 percent rate of growth outpaced the nation and New York state, according a report released today by State Comptroller Thomas P. DiNapoli.
“New York City’s unemployment rate is at a historic low and job growth over the past decade has been unprecedented,” DiNapoli said. “The strong employment trends have helped boost personal income and sales tax collections, making it easier for the city to afford new services and to balance the budget. Still, some sectors have lost jobs in the past year or seen growth slow.”
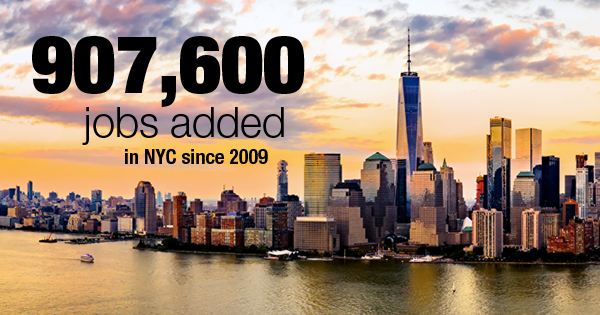
New York City is benefiting from the longest and largest job expansion since the end of World War II. The 907,600 jobs added since 2009 is twice as many as during the 1992-2000 expansion, the previous record-holder, DiNapoli’s report found.
The city’s job growth rate from 2009 to 2019 was 24.3 percent, compared to 15.3 percent for the nation and 14.5 percent for the state as a whole.
In 2019, job growth was concentrated in three employment sectors with health care accounting for 35,300, or 40 percent, of the jobs added. Over the past ten years, health care has added 180,800 jobs, representing one-fifth of the jobs added since 2009.
Employment in social assistance has risen steadily since 1990, reaching 212,800 in 2019. Job growth in the social assistance sector was particularly strong in the past two years, with 10,900 jobs added in 2018 and another 12,300 added in 2019. Much of the growth was driven by an increase in jobs that serve the elderly and people with disabilities.
Business services (which includes accountants, lawyers, programmers and clerks) added 18,200 jobs in 2019, the smallest gain since 2010 when the current job expansion began. Nonetheless, the sector added 211,200 jobs between 2009 and 2019, the most of any sector during this period, accounting for 23 percent of those added in the city since the end of the recession.
Job growth in the construction sector has begun to slow although it still set a record in 2019. While the industry added 300 jobs in 2019, it was the smallest gain since the end of the recession.
The financial activities sector added an average of 7,200 jobs in 2018, but lost 2,800 in 2019. Although commercial and retail banking added jobs, the rest of the sector (e.g., real estate, insurance and securities) lost 3,700 jobs.
The securities industry lost 1,300 jobs in 2019 and remains almost 5 percent smaller than before the recession. Despite accounting for less than 5 percent of private sector employment, the securities industry has the highest average salaries of any major sector and is responsible for one-fifth of all private sector wages paid in New York City.
DiNapoli’s report notes that employment in the technology sector, made up of components of the business services, information and manufacturing sectors, grew by 78 percent (62,000 jobs) between 2009 and 2018 (the latest available data), reflecting New York City’s expanding role as a national center for technology.
The boroughs outside of Manhattan were responsible for 48 percent of the citywide private sector job gains over the past ten years, a larger share than in any prior expansion since at least 1975. As a result, the unemployment rate has fallen to historic lows across the city.
The unemployment rate fell from 9.3 percent in 2009 during the Great Recession to 4.1 percent in 2018, the lowest level since 1976. The unemployment rate remained at its historic low of 4.1 percent in 2019.
While the unemployment rate for African-Americans declined from 15.4 percent in 2009 to 5.7 percent in 2017, it increased to 7.8 percent in the two following years. At the same time, rates for Asians (1.8 percent), Whites (2.6 percent) and Hispanics (4.8 percent) have continued to decline to all-time lows.
Read the full report, or go to: https://osc.state.ny.us/osdc/rpt11-2020.pdf
Find out how your government money is spent at Open Book New York. Track municipal spending, the state's 160,000 contracts, billions in state payments and public authority data. Visit the Reading Room for contract FOIL requests, bid protest decisions and commonly requested data.