

Subscribe for Latest Updates
The State Comptroller’s Office is committed to keeping New Yorkers regularly updated on the State’s economy and finances. Subscribe to get the latest update.
December 16, 2020 Edition
Selected Economic Trends
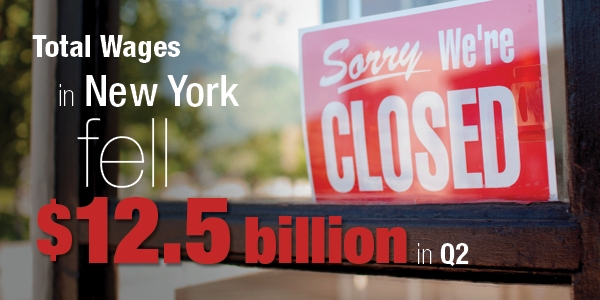
Total New York Wages Fell $12.5 Billion in Second Quarter
In the second quarter of 2020, total wages paid in New York State declined by $12.5 billion or 7.4 percent in comparison to the second quarter of 2019, according to new data from the U.S. Bureau of Labor Statistics (BLS). The decline is primarily attributable to the historic loss of 1.9 million jobs in March and April, with a limited employment rebound in May and June.
While previously available data have shown especially sharp job losses in certain sectors, the new wage data from BLS add to the picture. Total wages in accommodation and food services fell by $3.5 billion, a drop of nearly 60 percent from the prior year’s second quarter. Other New York industries with large declines in wages included construction, retail and wholesale trade, and the arts, entertainment and recreation sector (see nearby table).
In three sectors with comparatively higher compensation—finance and insurance, information, and professional and technical services—overall wages increased in the second quarter compared to a year earlier. The government sector also saw a modest gain.
| Total Wages | Change | ||
|---|---|---|---|
| Amount | Percentage | ||
| Finance and insurance | $22,369.4 | $714.4 | 3.3% |
| Information | $8,986.7 | $318.6 | 3.7% |
| Professional and technical services | $19,296.3 | $297.3 | 1.6% |
| Government | $27,925.2 | $93.3 | 0.3% |
| Agriculture, forestry, fishing and hunting | $252.7 | $2.7 | 1.1% |
| Mining | $77.2 | ($8.3) | -9.7% |
| Utilities | $1,142.3 | ($64.7) | -5.4% |
| Educational services | $5,680.2 | ($101.1) | -1.7% |
| Real estate | $3,305.9 | ($210.3) | -6.0% |
| Health care and social assistance | $20,551,1 | ($528.5) | -2.5% |
| Other services | $3,327.7 | ($647.6) | -16.3% |
| Transportation and warehousing | $2,783.0 | ($681.6) | -19.7% |
| Manufacturing | $6,648.4 | ($700.7) | -9.5% |
| Management of companies and enterprises | $4,430.0 | ($759.6) | -14.6% |
| Arts, entertainment and recreation | $1,395.8 | ($961.3) | -40.8% |
| Wholesale trade | $6,036.2 | ($1,005.3) | -14.3% |
| Administrative and waste services | $6,006.1 | ($1,318.9) | -18.0% |
| Retail trade | $7,066.9 | ($1,615.9) | -18.6% |
| Construction | $5,551.6 | ($1,872.6) | -25.2% |
| Accommodation and food services | $2,427.2 | ($3,525.5) | -59.2% |
|
Note: Sectors shown in declining order of change in wages Source: U.S. Bureau of Labor Statistics |
|||
While total wages fell in every region of the State, the severity of the decline varied, as shown in the table below. New York City suffered more than half of the statewide loss of total wage income, nearly $7.5 billion, but Long Island experienced the steepest decline at nearly 10 percent. The Capital Region fared the best among the regions, with a loss of 3.6 percent, due in part to its concentration of comparatively stable government employment and an increase in overall manufacturing wages.
| Total Wages | Change | ||
|---|---|---|---|
| Amount | Percentage | ||
| Capital Region | $7,209.0 | ($270.8) | -3.6% |
| Central New York | $4,088.1 | ($333.8) | -7.5% |
| Finger Lakes | $6,699.0 | ($467.7) | -6.5% |
| Hudson Valley | $14,062.5 | ($690.3) | -4.7% |
| Long Island | $18,289.0 | ($1,980.1) | -9.8% |
| Mohawk Valley | $1,991.3 | ($158.0) | -7.4% |
| New York City | $88,238.6 | ($7,464.8) | -7.8% |
| North Country | $1,614.9 | ($141.4) | -8.0% |
| Southern Tier | $3,095.0 | ($215.1) | -6.5% |
| Western New York | $7,168.9 | ($699.2) | -8.9% |
|
Source: U.S. Bureau of Labor Statistics |
|||
Insufficient Food Remains a Threat, Especially in Black and Hispanic Households
Ten months after the economic devastation of COVID-19 began, food insecurity remains a threat to the well-being of many New Yorkers. At times during the two-week period ending November 23, 2020, one out of eight households (12.4 percent) in the State “sometimes or often” did not have enough to eat, according to the U.S. Census Bureau’s Household Pulse Survey. This figure, representing nearly 1.6 million adult New Yorkers, is among the highest percentages reported for New York in Census Bureau surveys going back to late April. Food insufficiency was especially high among Black and Hispanic/Latino households, and higher among women than men, as shown below. While food scarcity was an issue before the pandemic, its impact was more limited then, affecting about 9 percent or 1.1 million adult New Yorkers, according to the Census Bureau survey data. Both counts of individuals omit unspecified numbers of children, which would add significantly to the totals.
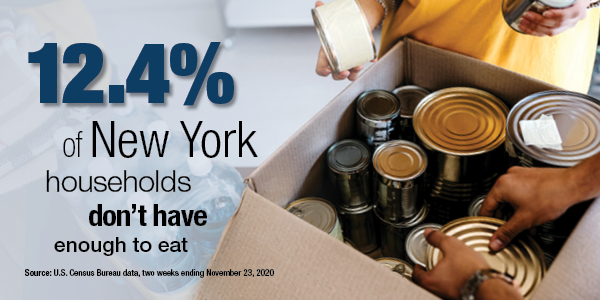
Source: U.S. Census Bureau data, two weeks ending November 23, 2020
Nearly 2.8 million New Yorkers received Supplemental Nutrition Assistance Program benefits (SNAP, formerly known as food stamps) in September, according to the latest available data. That total was up by 229,435 people or 9 percent since February, according to data from the State Office of Temporary and Disability Assistance. New York City SNAP beneficiaries totaled 1.7 million in September, up by 15.1 percent or 224,080 since February. Among counties outside the City, Suffolk had the highest percentage increase at 12.8 percent, followed by Albany (10.6 percent) and Nassau (5.3 percent). However, in a majority of New York State counties, SNAP enrollment has dropped since February, including declines of more than 9,500 in Monroe County and more than 1,800 in Broome County. Reasons for significant increases in some counties and declines in others are not immediately clear.
- SNAP Recipients in New York State by County, February–September 2020 (Table)
-
County Recipients,
September 2020Change, February to
September 2020% Change, February to
September 2020Albany 34,609 3,319 10.6% Allegany 4,628 (397) -7.9% Broome 25,035 (1,882) -7.0% Cattaraugus 10,172 (222) -2.1% Cayuga 8,757 (210) -2.3% Chautauqua 22,734 (1,015) -4.3% Chemung 13,321 402 3.1% Chenango 5,415 (441) -7.5% Clinton 10,679 472 4.6% Columbia 5,500 206 3.9% Cortland 5,534 56 1.0% Delaware 3,982 (224) -5.3% Dutchess 16,978 (588) -3.3% Erie 143,540 4,388 3.2% Essex 2,967 (132) -4.3% Franklin 6,274 (373) -5.6% Fulton 6,953 (24) -0.3% Genesee 4,501 (178) -3.8% Greene 4,232 (91) -2.1% Hamilton 256 (25) -8.9% Herkimer 8,246 (151) -1.8% Jefferson 13,714 (911) -6.2% Lewis 2,650 (124) -4.5% Livingston 5,774 94 1.7% Madison 5,767 (556) -8.8% Monroe 102,614 (9,552) -8.5% Montgomery 7,380 (451) -5.8% Nassau 43,320 2,171 5.3% New York City 1,705,337 224,080 15.1% Niagara 25,210 (1,373) -5.2% Oneida 36,942 126 0.3% Onondaga 66,061 1,564 2.4% Ontario 7,936 (385) -4.6% Orange 38,878 855 2.2% Orleans 5,160 34 0.7% Oswego 16,518 (1,253) -7.1% Otsego 4,855 (406) -7.7% Putnam 2,066 (42) -2.0% Rensselaer 13,192 (763) -5.5% Rockland 41,699 1,111 2.7% St. Lawrence 12,564 (736) -5.5% Saratoga 12,293 (432) -3.4% Schenectady 21,097 997 5.0% Schoharie 3,442 (64) -1.8% Schuyler 2,022 (90) -4.3% Seneca 2,986 (130) -4.2% Steuben 9,647 (143) -1.5% Suffolk 98,926 11,198 12.8% Sullivan 12,242 (296) -2.4% Tioga 4,680 (121) -2.5% Tompkins 7,019 (113) -1.6% Ulster 16,536 415 2.6% Warren 5,834 (560) -8.8% Washington 6,075 (84) -1.4% Wayne 7,901 (244) -3.0% Westchester 72,797 3,194 4.6% Wyoming 2,188 (187) -7.9% Yates 1,898 (278) -12.8% New York State 2,789,533 229,435 9.0% Source: New York State Office of Temporary and Disability Assistance
Since April, New York SNAP recipients who were not already receiving the maximum allotment for their household size have been receiving emergency maximum benefits. As a result, average monthly SNAP expenditures in New York (funded entirely by the federal government) have increased by over 40 percent to $503.4 million from April through September. New York has received federal approval to continue issuing the emergency allotments at least through December.
While increased SNAP benefits are helping low-income families and individuals put food on the table, the Census data on food insecurity raise important questions about the continued availability of such benefits, and the overall adequacy of public and private food programs. It is uncertain whether Washington will take further steps to mitigate the threat of hunger and, if so, when such action may occur.
New York State Budget and Spending
State tax revenues for the fiscal year to date totaled $48.1 billion through November, $3 billion lower than the same period in the previous year, according to the monthly State Cash Report released by Comptroller DiNapoli on December 15. November tax receipts were $806.7 million higher than the latest projection by the Division of the Budget.
On December 9, the State repaid $1 billion of short-term notes issued earlier this year for cash-flow purposes, plus $11.6 million in accrued interest. The second and final scheduled repayment, for $3.4 billion in personal income tax notes plus $133 million in accrued interest, is to be paid in March. The State has also established a $3 billion line of credit that could be used for short-term borrowing, but has not drawn on it to date.
S&P Global Ratings revised the State’s credit rating outlook to negative, while making no change to the State’s AA+ general obligation rating or related credit ratings. S&P cited “heightened risks to the state’s ability to maintain structural budgetary balance and effectuate planned budget reductions” in the current and coming fiscal years. The December 10 announcement followed actions on New York City’s credit ratings, in which S&P revised its outlook to negative and Fitch Ratings downgraded the City from AA to AA-. Fitch also issued an updated review of the State, making no changes to its ratings or outlook.
Prior Editions
- December 2, 2020
- November 12, 2020
- October 28, 2020
- October 14, 2020
- September 30, 2020
- September 16, 2020
- September 2, 2020
- August 19, 2020
- August 5, 2020
- July 22, 2020
- July 9, 2020