This Google™ translation feature is provided for informational purposes only.
The New York State Office of the State Comptroller's website is provided in English. However, the "Google Translate" option may help you to read it in other languages.
Google Translate™ cannot translate all types of documents, and it may not give you an exact translation all the time. If you rely on information obtained from Google Translate™, you do so at your own risk.
The Office of the State Comptroller does not warrant, promise, assure or guarantee the accuracy of the translations provided. The State of New York, its officers, employees, and/or agents are not liable to you, or to third parties, for damages or losses of any kind arising out of, or in connection with, the use or performance of such information. These include, but are not limited to:
damages or losses caused by reliance upon the accuracy of any such information
damages incurred from the viewing, distributing, or copying of such materials
Because Google Translate™ is intellectual property owned by Google Inc., you must use Google Translate™ in accord with the Google license agreement, which includes potential liability for misuse: Google Terms of Service.
2019 Financial Condition Report For Fiscal Year Ended March 31, 2019
Real Property Taxes and Sales Taxes Are Major Local Revenue Sources
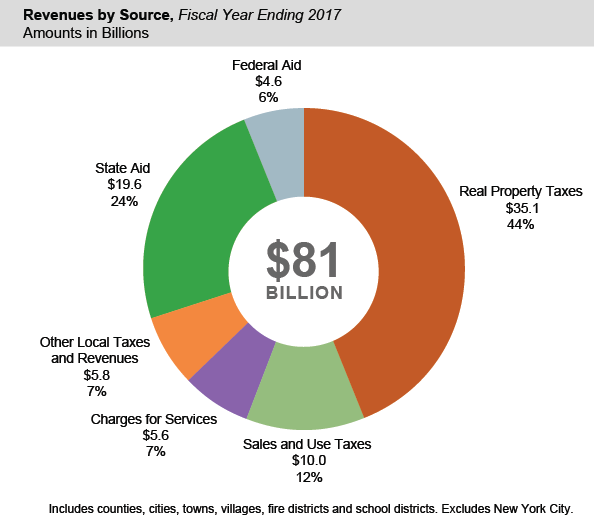
Real property taxes remain the single largest source of local government revenue in the State, making up $35.1 billion or 44 percent of the $81 billion in total revenue from local fiscal years ending in 2017.
The governments that are the most dependent on the property tax for their revenues include fire districts (where property taxes account for 94 percent of total revenue), school districts (54 percent), towns (54 percent) and villages (49 percent).
Sales taxes are also an important revenue source for local governments ($10 billion or 12 percent of total revenue) and are the largest single revenue source for counties (33 percent).
Sales tax collections grew by 5.3 percent in calendar year 2018 compared with 2017, but were only up 3.3 percent in the first half of 2019 compared with the same period in 2018.
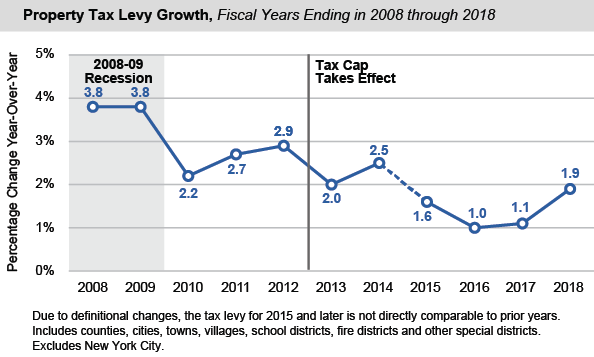
Property Tax Levy Growth Remains Relatively Low
Annual increases in property tax levies have been below 2 percent since 2015, though they did reach 1.9 percent in 2018.
One reason for this slow growth may be the inflation adjustment to the Real Property Tax Levy Limit (commonly called the “tax cap”). Each local government’s tax cap calculation involves a multi-step formula, but generally, the law limits levy increases to the lesser of 2 percent or the rate of inflation, with some exceptions, and that inflation rate has been under 2 percent in recent years.
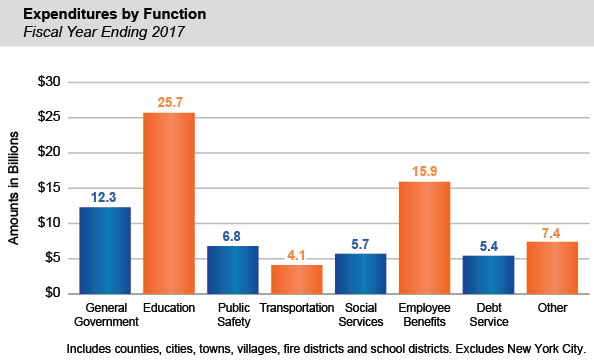
Education and Employee Benefits Account for Half of Local Government Expenditures
In 2017, total local government expenditures were $83.3 billion. Counties spent $25.0 billion, cities (not including New York City) spent $5.1 billion, towns spent $7.7 billion, villages spent $3.0 billion, fire districts spent $0.9 billion and school districts spent $41.6 billion.
The mix of local government expenditures varies by class. Overall, education made up 31 percent of total local government expenditures for the 2017 fiscal year ($25.7 billion). Most of this is school district spending on primary and secondary education.
Employee benefits accounted for another 19 percent of local government spending ($15.9 billion). This is the fastest growing segment, increasing at an annual rate of 3.9 percent over the 10-year period ending in the 2017 fiscal year, compared to an annual rate of growth in other expenditures of 2.0 percent.
Fiscal Stress Remains Low Overall, but Increasing for Cities
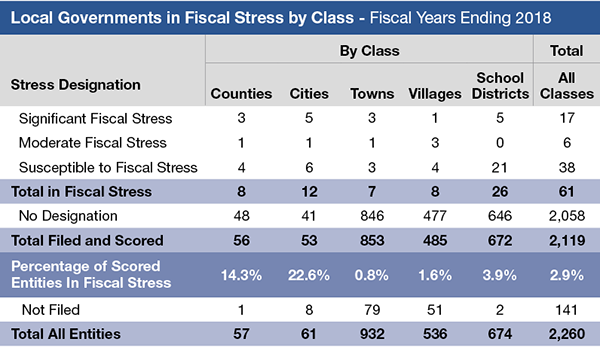
The Office of the State Comptroller analyzes the financial condition of each municipality and school district through its Fiscal Stress Monitoring System, which combines a number of financial indicators into an overall score intended to measure entities’ budgetary solvency.
In 2018, 61 local governments and school districts were designated as being in fiscal stress (2.9 percent of those scored). Of these, 17 were in significant fiscal stress, six were in moderate fiscal stress, and 38 were susceptible to fiscal stress.
School districts had the highest number of entities in stress, with 26 in total.
However, cities had the highest prevalence of stress, with 22.6 percent of them (12 of 53 scored) being in some level of stress. This was also an increase from 2017, when 14.5 percent (8 of 55 cities scored) were in stress.
Just over 14 percent of scored counties (8 of 56 counties scored) were in a stress category, down slightly from nearly 18 percent (10 of 56 counties scored) in 2017.
Towns and villages had much lower rates of stress than other classes of local government.