
Environmental Protection Fund (EPF)
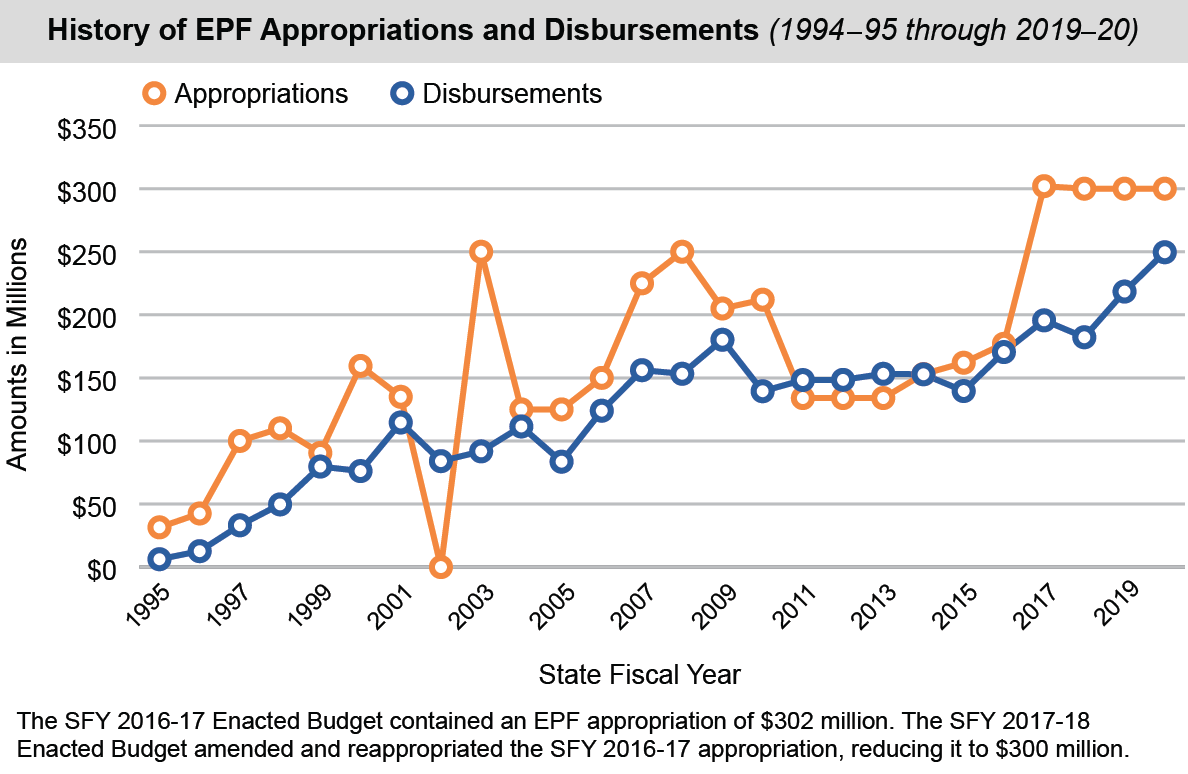
Created in 1993, the EPF:
- Provides an ongoing source of primarily pay-as-you-go funding to address the State’s environmental needs.
- Supports a broad array of environmental programs, such as State and municipal open space conservation; municipal and agricultural non-point source water pollution control; State and local parks projects; municipal water pollution control and aquatic habitat conservation; support for the State’s zoos, botanical gardens and aquaria; waterfront revitalization; farmland conservation; and municipal climate change mitigation and resilience programs.
- Has been primarily funded with a portion of the State’s real estate transfer tax. However, from SFY 2014-15 through SFY 2019-20, General Fund Transfers were also a recurring funding source and accounted for 21 percent of EPF funding.
- Appropriations to the EPF have fluctuated over the life of the Fund. In SFY 2019-20, the EPF appropriation was $300 million.
Department of Environmental Conservation (DEC)
- In SFY 2019-20, DEC All Funds spending totaled $1.2 billion, an increase of $27 million (2.2 percent) over SFY 2018-19.
- As of March 31, 2020, employment at DEC reached 3,017 Full-Time Equivalent (FTE) positions, an increase of 21 FTEs over levels as of March 31 in the previous year. However, the 2020 figure was down 12.7 percent from March 31, 2010.
Air
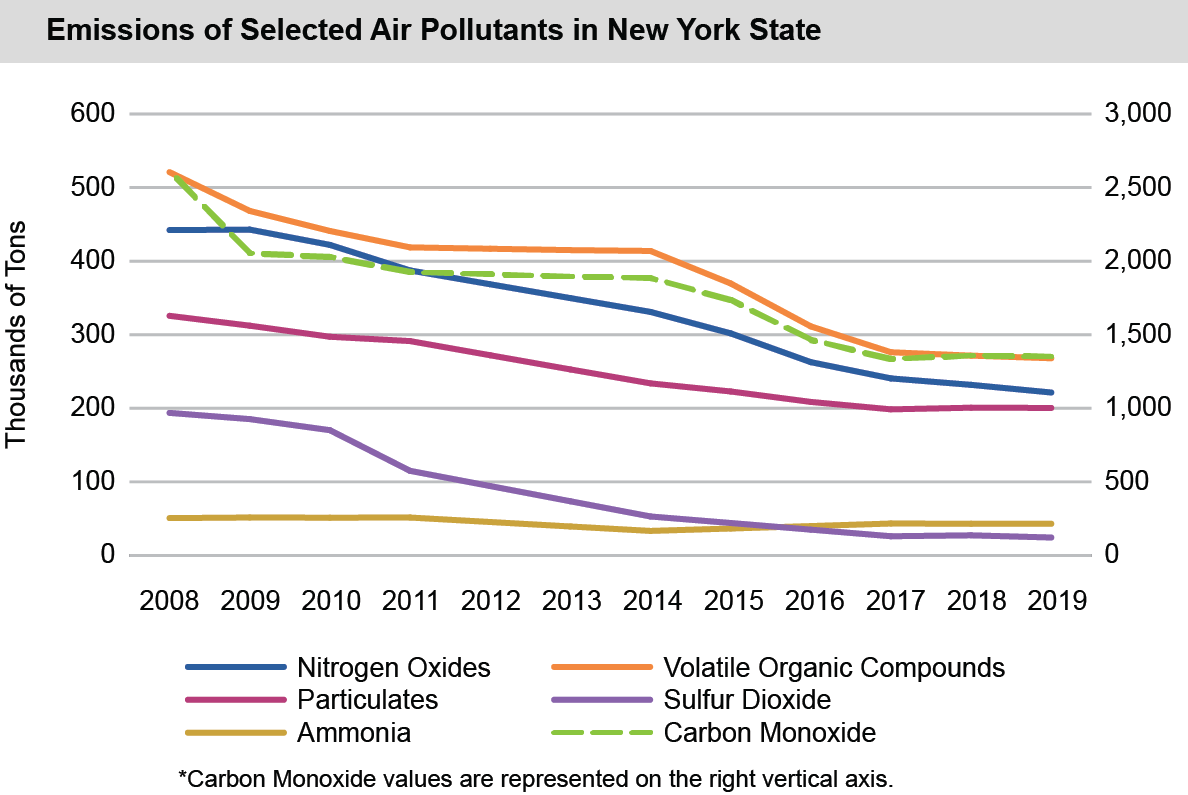
- For 2019, the U.S. Environmental Protection Agency’s State Average Annual Emissions Trend report shows estimated total emissions in New York from certain criteria pollutants covered by the National Ambient Air Quality Standards, excluding lead, of 2.1 million tons, a decrease of 1.2 percent from the previous year’s estimated emissions and a decrease of more than 49 percent from 2008. These emissions include nitrogen oxides, volatile organic compounds, particulate pollution, sulfur dioxide, carbon monoxide and ammonia. Nitrogen oxides and volatile organic compounds are precursors of ground level ozone, or smog. Sulfur dioxide is a precursor of particulate formation in the atmosphere and of acid rain.
- Highway and off-highway vehicles and engines are the largest sources of carbon monoxide, with 555,398 and 605,404 tons of emissions, respectively. Together these sources account for 85.9 percent of total carbon monoxide emissions.
- Solvent utilization was New York State’s leading source of volatile organic compound emissions in 2019, with 110,059 tons of emissions or 41.1 percent of the total.
- Highway vehicles in New York were the leading emitter of nitrogen oxides in 2019, with 76,111 tons of emissions or 34.4 percent of the total.
- Mining and quarrying, construction, agriculture and road dust combined were New York’s most significant source of particulates in 2019, with 139,983 tons of emissions, 69.8 percent of the total.
- Fuel combustion by industry was the leading source of New York’s sulfur dioxide in 2019, with 11,720 tons of emissions or 48.1 percent of the total.
- Agricultural livestock and fertilizer application combined were the leading source of ammonia in 2019, with 36,477 tons of emissions or 84.7 percent of the total.
Water
- In 2019, there were reported incidences of harmful algal blooms (HAB) on 188 bodies of water in New York State, an increase of 15 over the prior year. Of these water bodies:
- 59 percent experienced more than one HAB event,
- 12 percent experienced between 10 and 20, and
- 12 water bodies experienced 20 or more.
Cayuga Lake, in the Finger Lakes region, had the largest number of observed HAB events, with 103.
- A $2.5 billion capital projects appropriation was included in the SFY 2017-18 Enacted Budget for clean water infrastructure projects, including those projects authorized by the New York State Clean Water Infrastructure Improvement Act of 2017. Eligible projects include nonagricultural nonpoint source control; municipal waste water treatment; remediation of contaminated sites that contribute to water contamination; source water protection; and upgrades to septic systems and cesspools. As of March 31, 2020, $190.7 million (7.6 percent) had been spent from this appropriation.
- An additional $500 million in appropriations for water infrastructure projects were included in the SFY 2019-20 and SFY 2020-21 Enacted Budgets.
Solid Waste
- The SFY 2019-20 Enacted Budget included a statewide ban on most plastic carryout bags distributed by retail stores to package and carry purchases. In addition, the Budget authorized an optional 5 cent charge on paper bags that may be adopted by cities or counties. The law became effective in March of 2020, but the COVID-19 pandemic has led to delays in enforcement.
- The SFY 2020-21 Enacted Budget included a statewide ban on most Styrofoam food service containers and Styrofoam loose fill packaging, commonly referred to as “packing peanuts.”
Energy
In 2019, legislation was enacted establishing the Climate Leadership and Community Protection Act in New York State, which will require extensive changes in energy production and consumption throughout the State in future years. The legislation’s requirements include:
- A reduction in greenhouse gas emissions in the State of 40 percent below 1990 levels by 2030 and a reduction of 85 percent by 2050.
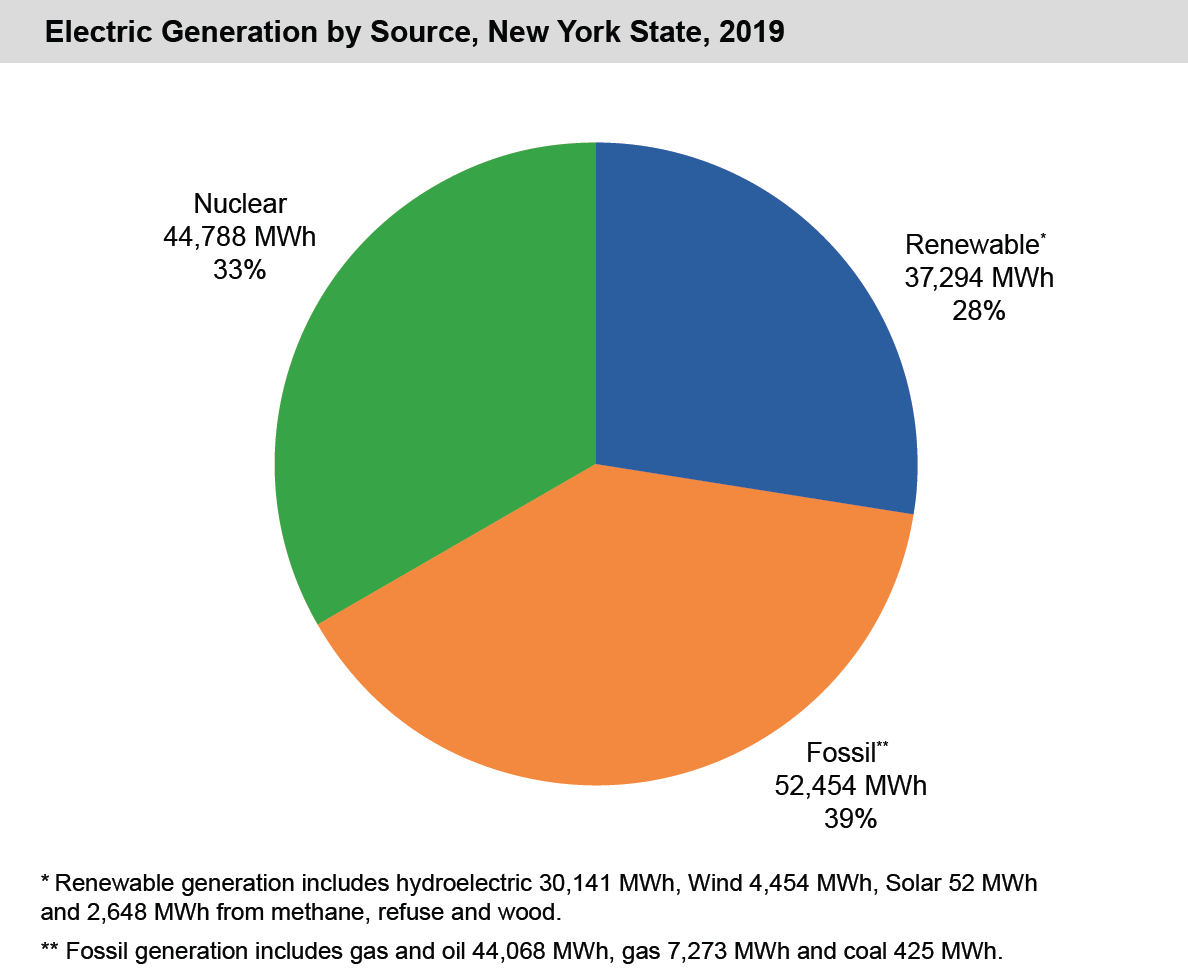
- Generation of 70 percent of electricity used in the State from renewable sources by 2030. By 2040, the State’s system to meet electric demand must generate no greenhouse gas emissions.
- Provisions to promote equity for disadvantaged communities in the legislation’s implementation.
According to the New York State Independent System Operator, in 2019, 135,585 gigawatt hours of electricity were generated in New York State.
According to the U.S. Energy Information Administration:
- In 2017, New York State emitted 157.7 million metric tons of carbon dioxide due to energy use, or 23.9 percent lower than 1990 levels.
- In 2017, New York State had the most energy efficient economy among U.S. states, consuming 2.6 thousand BTUs for every dollar of gross domestic product.
- In 2018, with energy expenditures of $3,112 per person, New York State had the second lowest per capita energy expenditures of any state.
- For March 2020, New York State’s average residential natural gas price of $12.13 per thousand cubic feet was 17th in the nation.
- For April 2020, at 17.33 cents per kilowatt hour, New York State’s average residential electric rate was ninth in the nation.
Agriculture
According to the U.S. Department of Agriculture, in 2018:
- There were 33,400 farms in New York State.
- New York farms encompassed 6.9 million acres, with an average farm area of 207 acres.
- At $3,230 per acre, New York had the second lowest average value for farmland among Northeastern states—only Maine’s value was lower.
- The overall economic impact from New York farms as measured by net farm income was $1.1 billion, a decrease of more than 18 percent from 2017.
- Receipts from the sale of all agricultural commodities in New York State were approximately $5.4 billion.
- With total production of 1.4 billion pounds, New York was the second largest apple producer in the nation.
- New York was the fourth largest milk producer in the nation, at 14.9 billion pounds, and realized the third highest total sales, $2.7 billion, on this production.