This Google™ translation feature is provided for informational purposes only.
The New York State Office of the State Comptroller's website is provided in English. However, the "Google Translate" option may help you to read it in other languages.
Google Translate™ cannot translate all types of documents, and it may not give you an exact translation all the time. If you rely on information obtained from Google Translate™, you do so at your own risk.
The Office of the State Comptroller does not warrant, promise, assure or guarantee the accuracy of the translations provided. The State of New York, its officers, employees, and/or agents are not liable to you, or to third parties, for damages or losses of any kind arising out of, or in connection with, the use or performance of such information. These include, but are not limited to:
damages or losses caused by reliance upon the accuracy of any such information
damages incurred from the viewing, distributing, or copying of such materials
Because Google Translate™ is intellectual property owned by Google Inc., you must use Google Translate™ in accord with the Google license agreement, which includes potential liability for misuse: Google Terms of Service.
2020 Financial Condition Report For Fiscal Year Ended March 31, 2020
Real Property Taxes and Sales Taxes Are Major Local Revenue Sources
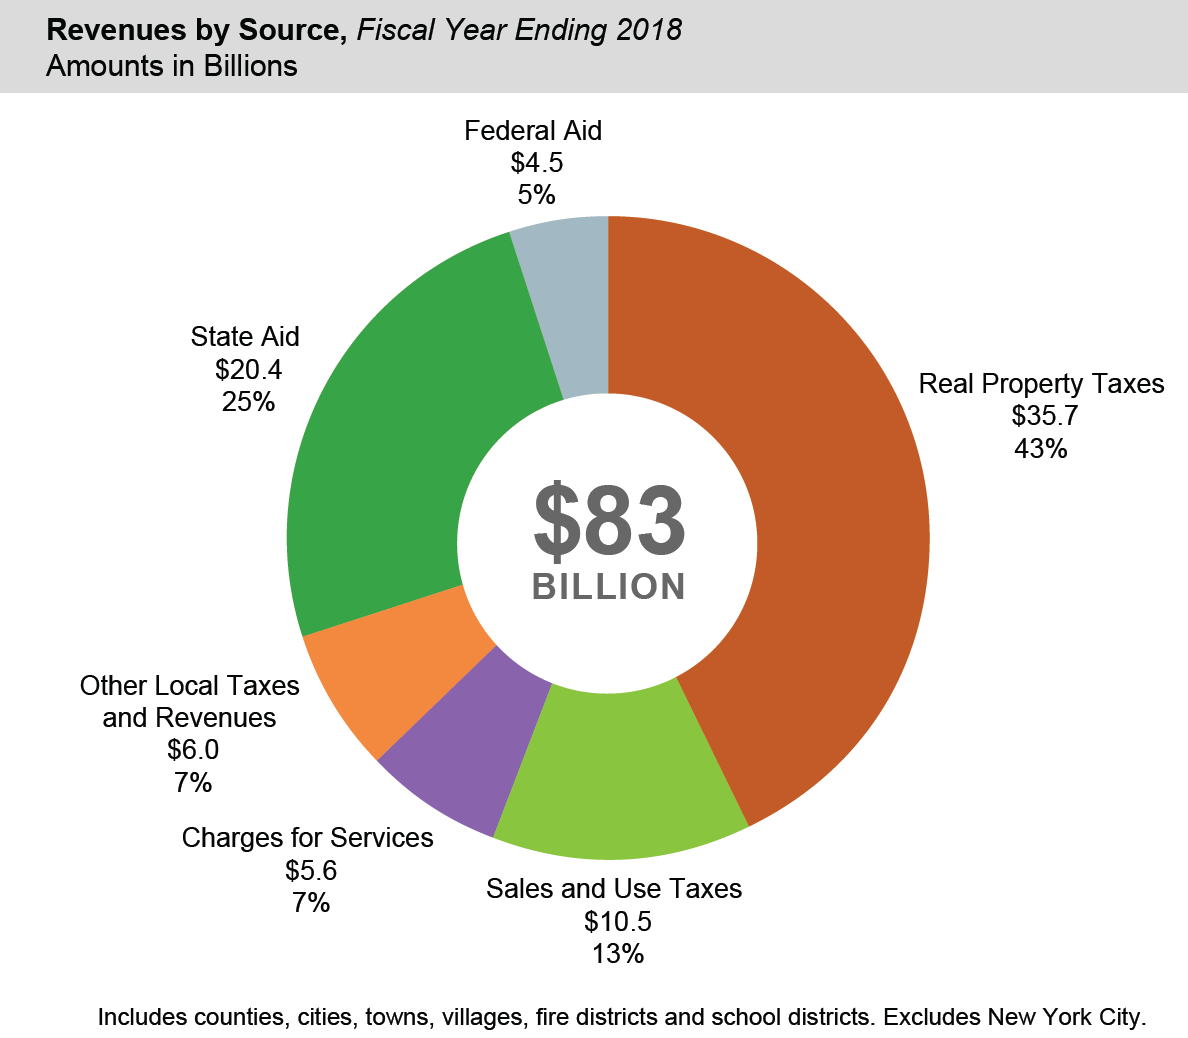
Real property taxes remain the single largest source of local government revenue in the State, accounting for $35.7 billion, or 43 percent, of the $83 billion in total revenue from local fiscal years ending in 2018 (not including New York City).
Fire districts are the most dependent class of local government on the property tax for revenue (which accounts for 93 percent of their total revenue), followed by school districts and towns (each at 54 percent), and villages (49 percent).
State aid is the next largest revenue source for local governments. It is a major source for school districts, accounting for 38 percent of total school district revenues. Other classes of local government also receive a significant share of their revenues from State aid—for social service programs in counties, for highways (mostly in cities and towns) and as unrestricted municipal aid (mainly in cities). In response to the COVID-19 pandemic, the State has utilized authority granted by the fiscal year 2021 budget to withhold $1.9 billion in State aid through the end of July 2020.
Sales and use taxes are also an important revenue source for local governments, representing $10.5 billion, or 13 percent of total revenue in 2018, and are the largest single revenue source for counties (34 percent).
Local sales tax collections totaled $18.3 billion in calendar year 2019, an increase of 4.7 percent over 2018. However, collections from January through July 2020 are down 11.3 percent over the same period last year due to the pandemic, which began to affect collections starting in March 2020.
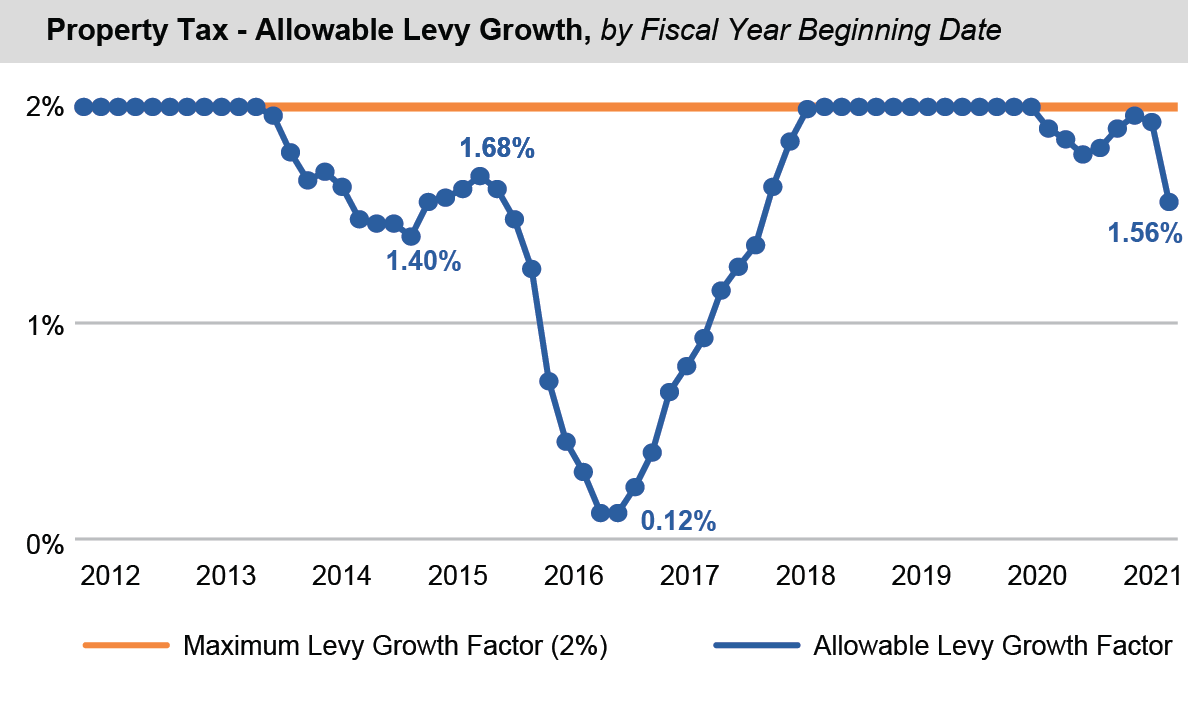
Property Tax – Allowable Levy Growth Is Declining
Generally, the property tax cap law limits levy increases to the lesser of 2 percent or the rate of inflation, with some exceptions, though each local government’s tax cap calculation involves a multi-step formula. The law also includes provisions for a local government to override the tax cap.
After nearly two years of allowable levy growth capped at the maximum 2 percent recently, the calculated allowable levy growth factor has dipped below 2 percent for all local governments responsible for reporting property tax cap elements to OSC over the past year. The rate of 1.56 percent calculated for local governments with fiscal years ending on 12/31/2021 represents the lowest allowable levy growth rate since 2017. While it has not approached the near-zero growth factor seen in 2016, these year-over-year reductions in allowable growth will reduce the budgetary flexibility many local governments may need as they feel the effects of the COVID-19 pandemic.
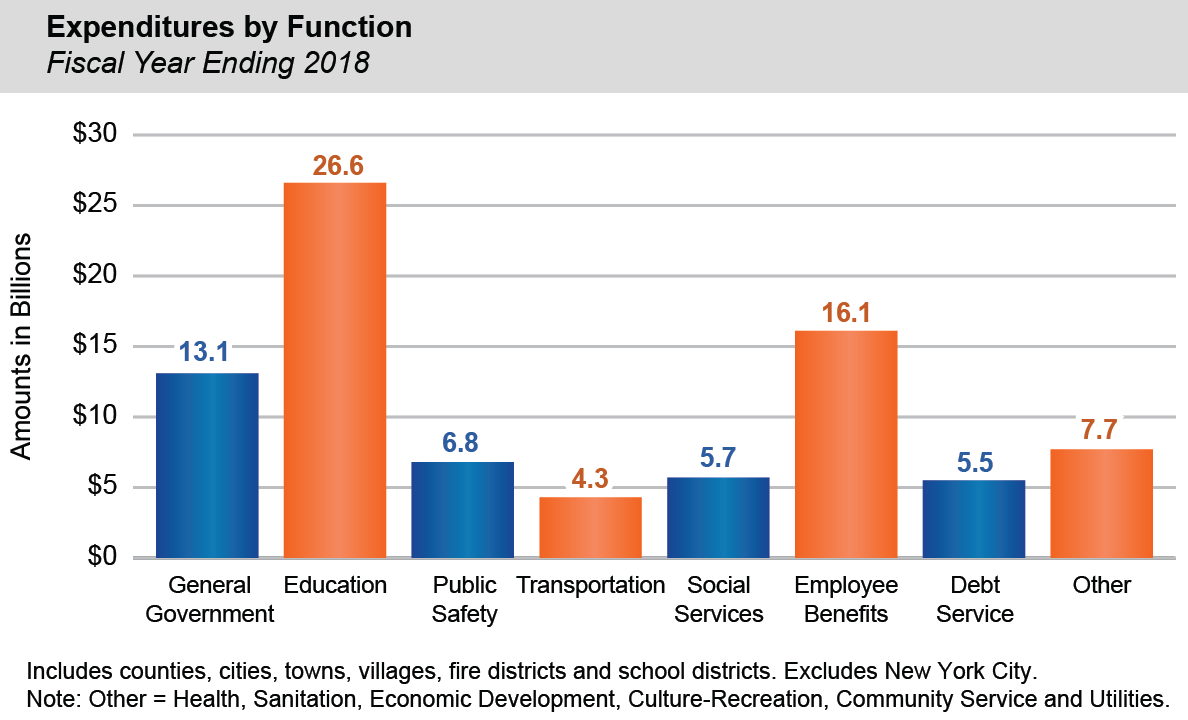
Education and Employee Benefits Account for Half of Local Government Expenditures
In 2018, total local government expenditures were $85.8 billion. Counties spent $25.4 billion, cities (not including New York City) spent $5.1 billion, towns spent $8.2 billion, villages spent $3.1 billion, school districts spent $43.1 billion and fire districts spent $0.9 billion.
The mix of local government expenditures varies by class. Overall, education made up 31 percent of total local government expenditures for the 2018 fiscal year ($26.6 billion). Most of this is school district spending on primary and secondary education.
Employee benefits accounted for another 19 percent of local government spending ($16.1 billion). This is the fastest growing segment, increasing at an annual rate of 3.7 percent over the 10-year period ending in the 2018 fiscal year, compared to an annual rate of growth in other expenditures of 2.0 percent or less.
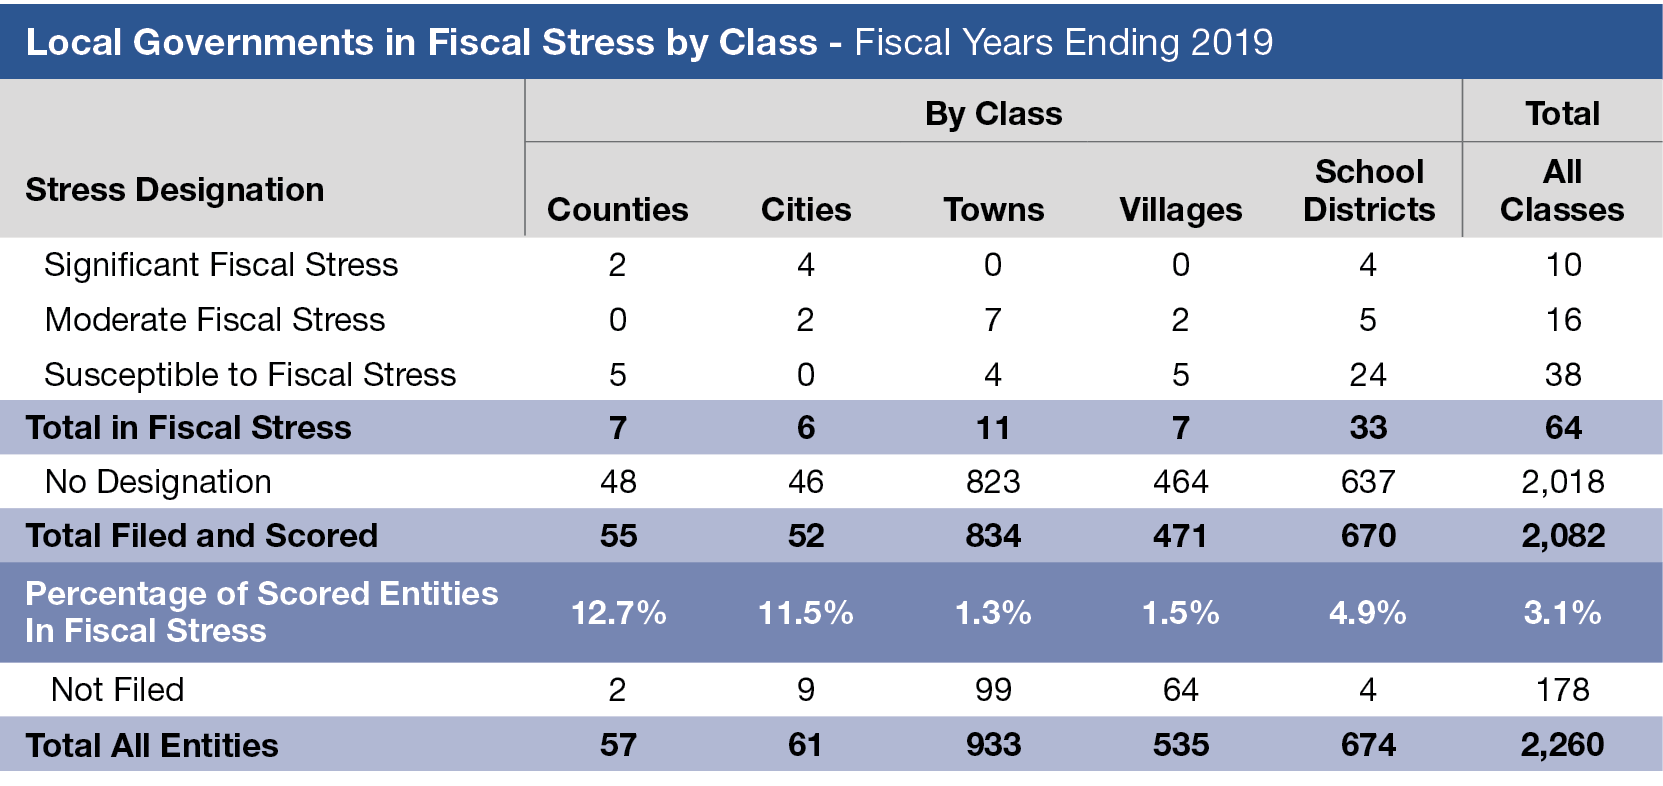
Fiscal Stress Remained Low in 2019, but Significant Risks Loom in 2020
The Office of the State Comptroller analyzes the financial condition of each municipality and school district through its Fiscal Stress Monitoring System, which combines a number of financial indicators into an overall score intended to measure entities’ budgetary solvency.
Based on 2019 financial reports, 64 local governments and school districts were designated as being in fiscal stress (3.1 percent of those scored). Of these, 10 were in significant fiscal stress, 16 were in moderate fiscal stress and 38 were susceptible to fiscal stress.
School districts had the largest number of entities in stress, with 33 in total.
However, counties had the highest prevalence of stress, with 12.7 percent (7 of 55 scored) being in some level of stress. This was a slight decline from 2018, when 14.3 percent (8 of 56 counties scored) were in stress.
For cities, 11.5 percent (6 of 52 cities scored) were in a stress category, a large decline from 22.6 percent (12 of 53 cities scored) in 2018.
Towns and villages had much lower rates of stress than other classes.
Looking forward, large declines in recent sales tax collections, the State’s withholding of aid to local governments and schools and increased stress on other revenue sources, combined with the demand for COVID-19 related emergency spending in 2020, has created a significant risk for local governments.