
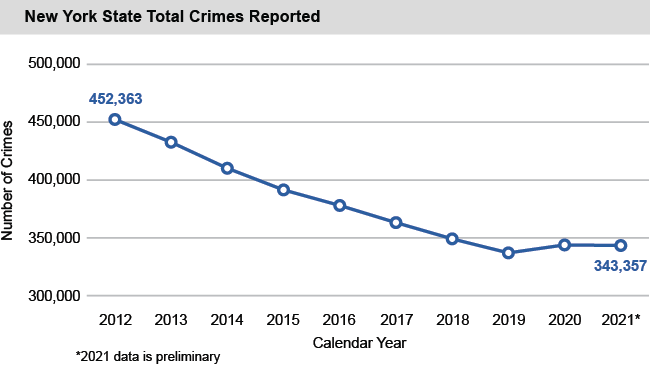
Number of Crimes and Crime Rates Leveled Off in 2021
- According to preliminary data, the number of crimes in seven major categories used by the State Division of Criminal Justice Services (DCJS) as indicators of overall crime trends (Index Crimes) leveled off in 2021, following the first increase in eight years in 2020. Total Index Crimes dropped by 504 reported incidents (less than 1 percent) to 343,357 in 2021.
- There are seven major categories of crime: four are violent crimes and three are property crimes.
- The four violent crime categories collectively rose by 7.8 percent from last year. Violent crimes include:
- Murder (up 4.4 percent in 2021 after a 45.8 percent jump in 2020);
- Rape (up 10 percent after a 15.8 percent decrease in 2020);
- Robbery (up 2.9 percent); and
- Aggravated assault (up 9.5 percent).
- Meanwhile, the three property crime categories, which compromised the majority of crimes committed, dropped 2.2 percent. Property crimes include:
- Burglary (down 16.6 percent to its 2019 number following the same percentage jump in 2020);
- Larceny (down 1.3 percent); and
- Motor vehicle theft (rising for the second year in a row — 10.9 percent in 2021 after the greatest crime percentage hike in 2020 of 54.1 percent).
- Despite the overall uptick in 2020 and the reported increase in violent crimes in 2021, Total Index Crimes are still 109,006 (or 24.1 percent) lower than they were in 2012 and incidents of violent crime still remain 4 percent lower than a decade ago.
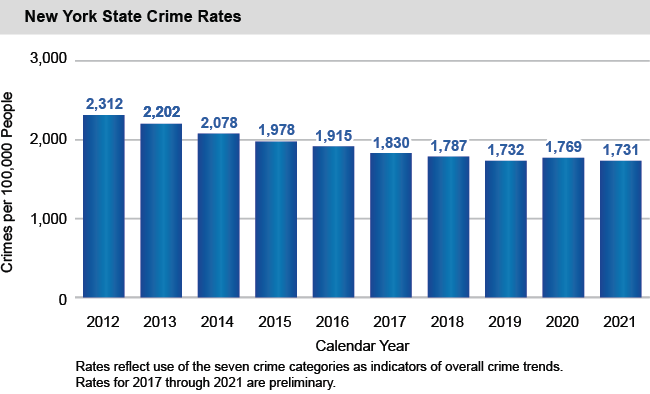
- Crime rates also reduced in 2021, decreasing by 2 percent to 1,731 crimes per 100,000 people. This brought the State crime rate back to the 2019 rate.
Incarcerated Individual Populations, Number of Facilities and Staff Numbers Keep Dropping
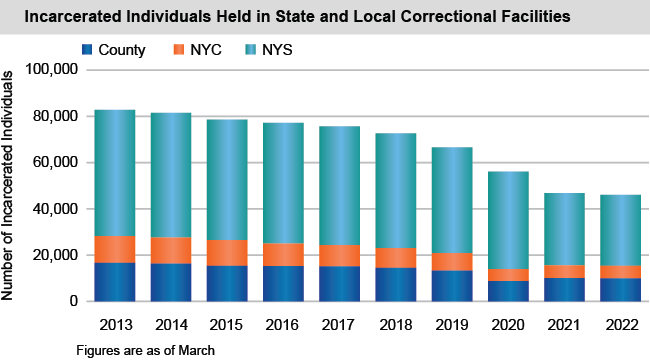
- As of March 2022, 46,046 incarcerated individuals—a decrease of 777 (1.7 percent) from the prior year—were held in 125 State and local correctional facilities, which include:
- 44 State correctional facilities (down from 50 following the closure of six State Department of Corrections and Community Supervision (DOCCS) facilities in March 2022);
- 63 county jail and correctional facilities; and
- 12 New York City correctional facilities.
- Over the last 10 years, the total incarcerated population declined by 39,118 (46 percent), with the majority of the decline occurring in State correctional facilities, followed by county jails and then facilities in New York City.
- The number of State prison incarcerated individuals declined 2 percent in SFY 2021-22, following larger drops in the prior three years (the number of State prison incarcerated individuals declined by 25.8 percent in SFY 2020-21; this drop was likely due, in large part, to policies put in place in response to the COVID-19 pandemic).
- The number of incarcerated individuals in county jails also dropped by 2 percent while numbers in New York City jails went up by a percentage point from the prior year.*
- Since 2011, the DOCCS has eliminated more than 13,000 prison beds and closed 24 State correctional facilities. DOCCS reports annual savings from these reductions of approximately $442 million.
- Reductions in DOCCS security staff (Correction Officers, Sergeants and Lieutenants) have been consistent with incarcerated population declines. Since 2011, the number of these positions filled has decreased by 11 percent. In 2021, there were a total of 17,415 positions filled, down 6 percent from the year before.
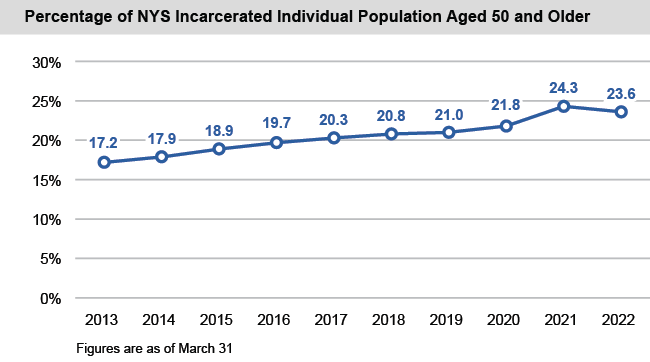
- Over the last 10 years, the proportion of incarcerated individuals aged 50 and over in State correctional facilities has increased by 45 percent. However, the March 31, 2022 share of this population saw a small decline from the prior year (down 0.7 percent). For more analysis of trends regarding the number of incarcerated individuals aged 50 and above, see OSC’s January 2022 report, “New York State’s Aging Prison Population.”
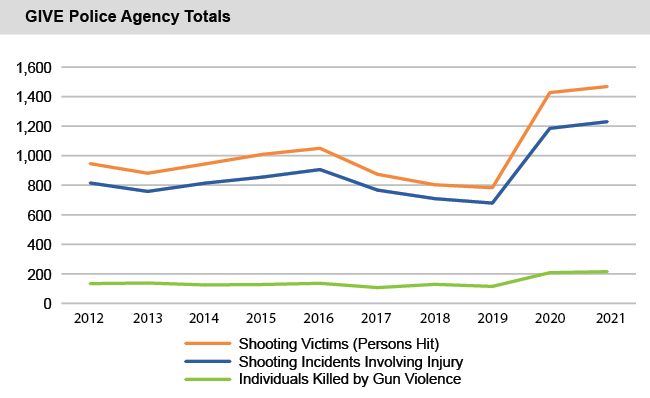
Combating Gun Violence
- The State Fiscal Year 2022-23 Enacted Budget included $135 million in spending aimed at gun violence prevention efforts. DCJS provides funding, training and technical support to 20 law enforcement agencies in 17 counties through the Gun Involved Violence Elimination (GIVE) initiative. According to preliminary DCJS data reported by these 20 police departments, incidents of gun-related violence involving injury rose by 75 percent in 2020 and continued to climb in 2021 in the areas reporting on this data.
- When comparing the five-year averages (2016-2020) to the number of reported incidents in 2021, shooting incidents resulting in injury or death reported by these 20 police departments are up 45 percent.
* In State Fiscal Year 2019-20, statutory changes to eliminate cash bail for most misdemeanor and non-violent felony offenses contributed to a 34 percent reduction in local jail populations. These reforms were amended in subsequent years to re-authorize bail for a limited number of offenses.