

New York’s Balance of Payments in the Federal Budget
Federal Fiscal Year 2020
Message from the Comptroller
March 2022

Since the onset of the COVID-19 pandemic, New Yorkers have seen how the fiscal and policy resources of the federal government can help in times of real need. The historic response from Washington, including financial support for individuals, businesses and state and local governments, will continue to impact our economy for years to come.
This report, the sixth in a series by the Office of the State Comptroller, details the differences among the 50 states with respect to what they pay in federal taxes and how much they receive in federal spending. The results for Federal Fiscal Year 2020 are heavily influenced by the emergency spending undertaken by the federal government in response to the COVID-19 pandemic and related economic disruptions. The surge in spending resulted in all states having a positive balance of payments for the first time in the history of this report.
For New York, funding levels for unemployment benefits, Medicaid, hospital facilities and transit services that were high relative to other states drove an improvement in the State’s per capita ranking from 49th most favorable in 2019 to 40th in 2020. At the same, New York continued to rank fourth for tax payments made to the federal government.
In Federal Fiscal Year (FFY) 2020, New York State generated $250 billion in federal taxes, and benefited from $396 billion in federal spending. For every tax dollar paid to Washington, our State received $1.59 in return—well below the national average of $1.92. While these results are an improvement from prior years, they reflect short-term measures, not an enduring policy change. As the COVID-19 pandemic wanes and the temporary federal spending ceases, the underlying trends are likely to return, with New York continuing to have a negative balance of payments.
The late Daniel Patrick Moynihan pioneered the concept of this balance of payments report when he represented New York in the United States Senate, and we are proud to carry on his work. Senator Moynihan believed that making the facts clear about how the federal budget distributes money among the states could help produce a more equitable outcome for all Americans. At this unique moment in history, I hope this report contributes to a constructive dialogue about how best to structure the fiscal relationship between the federal government and the states.
Thomas P. DiNapoli
State Comptroller
Table of Contents
The Balance of Payments Between the Federal Government and the States
Revenues Paid to the Federal Government
Federal Spending in the States
Assessing New York State’s Balance of Payments
Executive Summary
The budget of the United States government plays a major role in the finances of New York State and its local governments, as well as in the daily lives of New Yorkers. Federal decisions have had an important impact for decades, long before the COVID-19 pandemic disrupted the economy and tax revenues. Federal spending provides Social Security income, Medicare and Medicaid health coverage and other benefits for millions of State residents. Federal aid represents more than one in three dollars in the State Budget. Spending from Washington also supports tens of thousands of New York jobs.
The fiscal relationships between Washington and the 50 states vary widely, both overall and within particular budgetary areas. This report examines the flow of funds between the federal government and the states for the Federal Fiscal Year (FFY) ending September 30, 2020, with special attention to its impact on New York State. The analysis is based on data from federal budget documents, the Internal Revenue Service and other sources.
In FFY 2020, customary spending was supplemented on a historic and wide-ranging scale by the federal government as it began to respond to the COVID-19 pandemic. This high level of additional spending meant that all 50 states enjoyed a positive balance of payments with the federal government in FFY 2020, as residents, businesses and governments received more in federal funds than they paid in taxes. While New York and five other states had experienced a negative balance with the federal government in 2019, no state was a net donor in 2020.
Based on federal receipts and outlays analyzed for this report, New York State received $146 billion, or $7,236 per capita, more in federal spending than it paid in total taxes to the federal government in FFY 2020. In total, New York generated less in tax payments than in the prior year—about $250 billion compared to $265 billion—while it received $154 billion more in expenditures, for a total of $396 billion. New York still paid a high level of total and per capita federal taxes, ranking fourth nationally on the latter measure, but the per capita federal expenditures New York received in 2020 were higher than in two-thirds of all states.
Compared to FFY 2019, federal receipts from New York in 2020 fell at a rate more than twice that experienced nationwide, on average, while federal spending rose more rapidly than for other states. New York’s rank in the balance of payments among all states therefore rose to 40th from 49th in 2019. The return on every dollar New York generated in federal tax receipts also increased to $1.59 from 91 cents the prior year.
Federal pandemic relief to New York and other states drove this outcome in 2020. The State received over $130 billion through new temporary programs and other actions, along with a range of supplemental spending in existing programs. Funding received by New York that reflects high levels of per capita spending relative to other states include:
- $47.4 billion for unemployment compensation ($2,344 per capita);
- $39.3 billion through the Paycheck Protection Program ($1,948 per capita);
- $9.1 billion in Healthcare Provider Relief Funds ($451 per capita); and
- $2.0 billion in Transit Infrastructure Grants ($100 per capita).
The impact of federal relief and stimulus in response to COVID-19 on the balance of payments between the states and Washington is clear. Given the additional relief provided by the federal government in FFY 2021, and continued state access to such funding beyond this time period, outcomes in the balance of payments similar to those in FFY 2020 will likely result over the next several years. Because this funding is temporary, as authorization for its use expires, a return to the spending trends and balance of payments outcomes that were typically experienced prior to the COVID-19 pandemic is probable.
The largest of the broad spending categories in the federal budget represents direct payments to or for individuals for a variety of programs such as Social Security, Medicare, benefits for veterans and retired federal employees, and food assistance. In FFY 2020, this category also included large amounts of unemployment compensation and relief payments to households. Spending for such direct payments increased more than $1 trillion to reach a total of approximately $3.6 trillion nationwide. New York received an estimated $228.3 billion in this category, with a per capita figure that was moderately higher than the national average. Major programs for which the State received higher-than-average per capita expenditures include Medicare, food assistance, Supplemental Security Income (SSI) and unemployment benefits primarily related to the COVID-19 pandemic. Payments from Washington for federal employee retirement benefits and veterans’ benefits to New York were lower than average on a per capita basis.
The second largest spending category in FFY 2020 was for “All Other” outlays that were not placed in federal budget non-defense categories for direct payments, grants, interest or certain offsetting receipts. The total spent was approximately $1.2 trillion, more than four-and-a-half times greater than in 2019. This year’s analysis has been able to identify over three-fourths of 2020 spending in this category that represents new programs established by the federal Coronavirus Aid, Relief and Security Act (CARES Act), spending for pandemic relief purposes through existing programs and non-relief-related spending in existing programs where the increase was significant compared to the prior year. Of this $871 billion, New York received $65 billion largely for pandemic relief such as the Paycheck Protection Program, healthcare provider relief funds and the Coronavirus Relief Fund. See Other Identified Federal Spending for more explanation about these expenditures.
In the third largest spending category in the federal budget for 2020, grants to state and local governments, New York received almost $80 billion and fared better than 47 states on a per capita basis. Medicaid makes up more than half of all federal spending for such grants, and New York’s per capita Medicaid funding from Washington ranked second among the states.
In two other major categories—procurement and federal employee compensation—federal spending in New York was less than half of the national average on a per capita basis. The State’s combined total in these two areas, $22.4 billion, was 2.4 percent of the nationwide total.
Overall, New York State received 6.4 percent of total federal spending examined for this analysis, modestly more than the 5.9 percent received in the prior year. The State generated 7.8 percent of total federal tax revenue examined for this report, which was higher than its shares of the U.S. population (6.1 percent) and of the nation’s personal income (7.4 percent). On a per capita basis, federal tax revenues from New York State were 27.6 percent higher than the national average, partly because of taxpayers’ relatively higher incomes.
The federal budget deficit in FFY 2020, $3.1 trillion, arose from more than $6.5 trillion in outlays against $3.4 trillion in receipts. It represented current spending that was funded by borrowing and as a result, federal spending in the states was greater than federal revenue raised—the states, in the aggregate, and individually, received more than they paid that year.
Federal budget deficits (or surpluses) change over time, depending on many factors including shifts in the economy as well as policy actions that affect levels of spending and revenues. The federal deficit decreased incrementally to $2.78 trillion in FFY 2021, and is forecast to average $1.2 trillion from 2022 through 2031. Any future federal stimulus and relief enacted in response to the COVID-19 pandemic will continue to affect these amounts.
Federal spending and the burden of federal taxes are not apportioned to the states according to any single formula. Rather, dozens of statutory provisions as well as a wide range of economic, demographic and political factors drive the state-by-state distribution of costs and benefits. Examples of such factors include: each state’s population; its number of residents in poverty or eligible for Social Security, Medicare and Medicaid; income levels; and the state’s own policy choices. The 2020 Census results may affect New York’s and other states’ balance of payments in the longer term as updated population counts influence the state-by-state allocation of funding in certain programs and shift the size of some states’ Congressional delegations, including the reduction of New York’s representation by one.
Leaders in Washington continue to debate the federal government’s role in responding to the public health and economic crises brought on by the coronavirus pandemic. As this report makes clear, states do not share equally in the benefits of federal spending, nor in generating federal tax receipts. The data presented here is intended to help New Yorkers better understand how federal budget policies affect the State, and to promote the State’s interests in the nation’s fiscal debates going forward.
Introduction
This report examines the flow of funds between the federal government and the 50 states for the Federal Fiscal Year (FFY) ending September 30, 2020.1 The study includes three major parts:
- Identification of tax revenues paid to the federal government from each of the states and of dollars spent by the federal government in each state, also referred to as expenditures received by each state. Federal spending includes: direct payments to or for individuals (for example, Social Security and Medicare); grants to state and local governments (for Medicaid and other programs); procurement of military equipment and other goods and services; wages and salaries for federal government employees; and other spending by the federal government not reported as payments for individuals, grants or other purposes. See further discussion below.
- Analysis of these revenue and expenditure flows to determine the balance of payments—that is, the difference between revenues and expenditures—on the national level and in each of the 50 states.
- Review of specific elements of federal revenues and expenditures to identify how the composition of New York’s balance of payments differs from other states.
In FFY 2020, the federal government spent $6.55 trillion, and brought in $3.42 trillion in revenue, with a budget deficit of $3.13 trillion. For the purposes of this analysis, as in previous reports by the Office of the State Comptroller (OSC), certain revenue and spending amounts were excluded, resulting in an allocation of $6.2 trillion in expenditures and $3.2 trillion in tax revenues that are relevant and practical to allocate to the states. Approximately 94 percent of federal receipts and outlays are allocated by state in this report.2 A summary of the methodology used for this report can be found in Appendix B.
Federal budget documents report spending for non-defense purposes as: payments for individuals, either directly or through grants to state and local governments; all other grants; net interest; undistributed offsetting receipts; and “All Other.” Detail on the composition of this last category is not provided by federal budget materials. Prior reports by OSC have captured its contents indirectly through the identification and allocation of procurement and wages and salaries as well as the determination of non-allocable spending that includes unidentified outlays among other items (see footnote 2). The major increase in All Other disbursements in FFY 2020 and the significant level of COVID-19 emergency relief that is represented by this spending is included in this year’s analysis as a fifth category of expenditures by the federal government. See Other Identified Federal Spending for more explanation about these expenditures.
All figures in this report derive from OSC’s compilation and analysis of data from the U.S. Office of Management and Budget, the U.S. Internal Revenue Service, other federal agencies, the Federal Procurement Data System (through SAM.gov), USAspending.gov and Federal Funds Information for States, unless otherwise noted.
The Balance of Payments Between the Federal Government and the States
All 50 states received significantly more in federal expenditures than they generated in federal revenues in FFY 2020. Nationwide, the average gain was $8,916 per capita. In other words, U.S. residents on average received that much more in federal expenditures than they paid in federal taxes.
This outcome contrasts with 2019 and prior years, when New York and a handful of other states have had a negative balance of payments with the federal government. Large-scale historic spending by the federal government in response to the COVID-19 pandemic that was initiated in 2020 primarily through legislation drove the changes in the balance of payments experienced by the states in 2020.
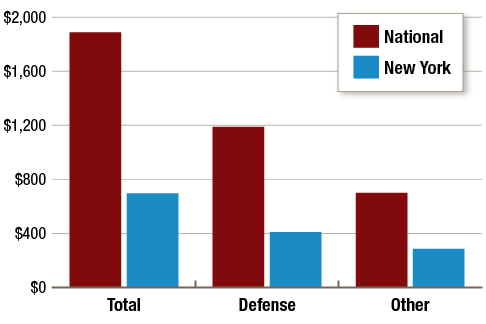
New York’s per capita contribution to the federal treasury was $12,353, exceeding the national average of $9,682 by 27.6 percent. New York received $19,589 in federal spending per capita, above the national average of $18,599 by almost $1,000. Thus, for every dollar New York generated in federal tax receipts, it received $1.59 back in federal spending, as compared to a national average of $1.92. The combination of federal tax payments and federal expenditures resulted in a $7,236 per capita surplus for the Empire State, for a national ranking of 40th most favorable. See Figures 1 and 2.
FIGURE 1 - Per Capita Balance of Payments Between the Federal Government and the States, FFY 2020
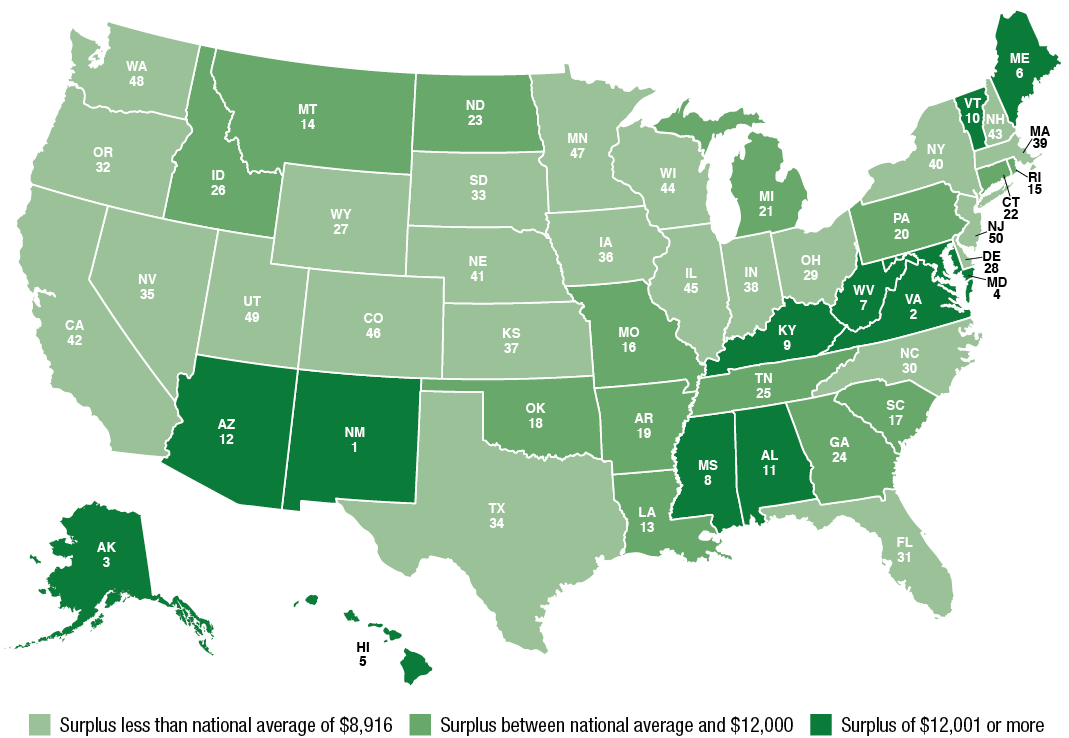
Note: The numbers shown in the map reflect each state’s ranking in per capita balance of payments for FFY 2020, from most favorable (1) to least favorable (50).
New Jersey and Utah had the lowest surpluses with the federal government of the 50 states; on a per capita basis, they were both under $5,000. Two states—Washington and Minnesota—had positive balances of payments under $6,000 per capita. New Mexico, Virginia, Alaska and Maryland fared the best with balances of payments over $15,000 per capita; New Mexico’s almost reached $17,000.
On the basis of total dollars rather than dollars per capita, New York’s ranking was fourth among the states, with a total surplus of $146 billion. California experienced the largest surplus in total dollars at almost $265 billion, followed by Texas at $241 billion. (Figures for all states appear in Appendix A.)3
FIGURE 2 - Per Capita Balance of Payments Between the Federal Government and the States, FFY 2020
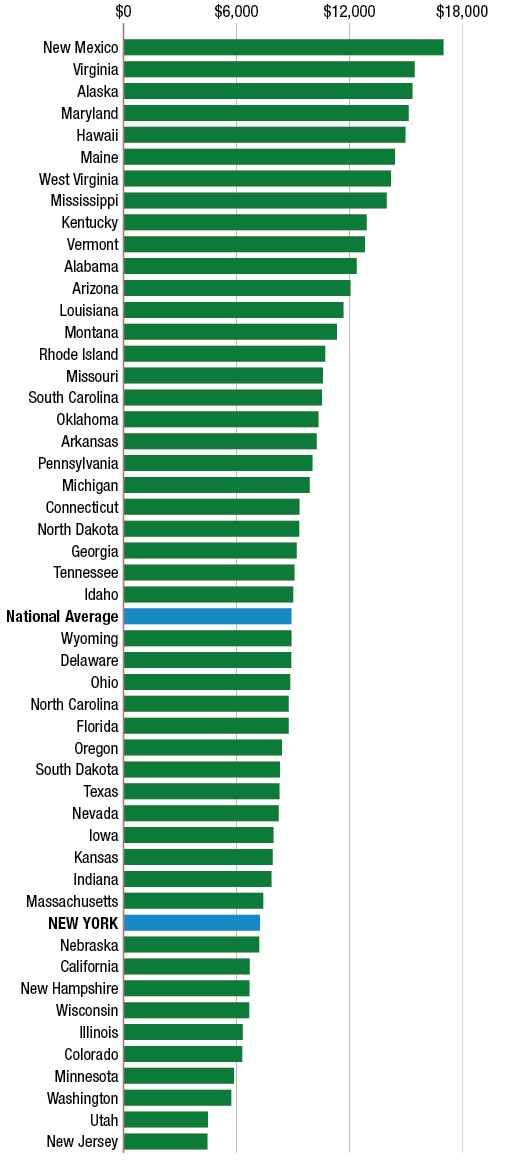
Note: Specific figures appear in Appendix A.
The Office of the State Comptroller has released five previous analyses of New York State’s balance of payments in the federal budget. These reports estimated negative balances of payments in the amounts of $19.9 billion in FFY 2013, $40.9 billion in FFY 2016, $24.1 billion in FFY 2017, $26.6 billion in FFY 2018 and $23.7 billion in FFY 2019. The following sections describe the dramatic changes in FFY 2020 in more detail.
Revenues Paid to the Federal Government
In 2020, all revenues paid to the federal government totaled $3.4 trillion. This figure primarily represents revenue from the following taxes, as classified by the federal Office of Management and Budget: personal or individual income tax; social insurance taxes and contributions; corporate income tax; excise taxes; and estate and gift taxes. For the 50 states and Washington, D.C., collections from these taxes generated a total of $3.2 trillion or $9,682 per capita in FFY 2020. A breakdown of all revenues in FFY 2020 is shown in Figure 3.
FIGURE 3 - Federal Revenues by Source in FFY 2020: $3.4 trillion
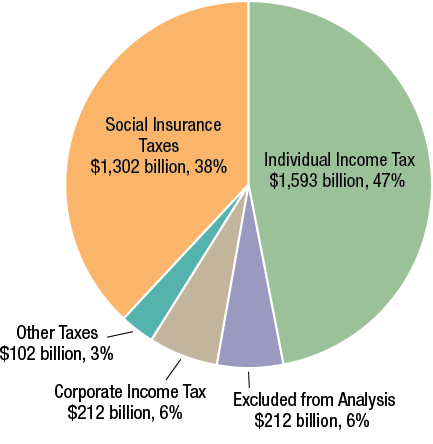
Note: See below for revenues included in Social Insurance Taxes. Other Taxes include excise taxes, which are primarily imposed on the production, sale or consumption of fuel, tobacco and alcohol products, among others; as well as estate and gift taxes. “Excluded from Analysis” represents miscellaneous receipts and customs duties and fees, along with revenues from Puerto Rico and other outlying areas.
New York generated 7.8 percent of the $3.2 trillion in federal tax payments, while the State represented 6.1 percent of the nation’s population in 2020. At $12,353, New York’s per capita contribution to the federal treasury was fourth highest among the states and 27.6 percent more than the national average, as illustrated in Figure 4.
Connecticut had the highest per capita contribution to the federal treasury at $13,912, followed by Massachusetts with $13,558 and New Jersey with $12,489. Mississippi generated the lowest per capita total tax payments at $5,822. New York’s total payments of $250 billion ranked third among the states behind California and Texas.
FIGURE 4 - Per Capita Taxes Paid to the Federal Government, FFY 2020
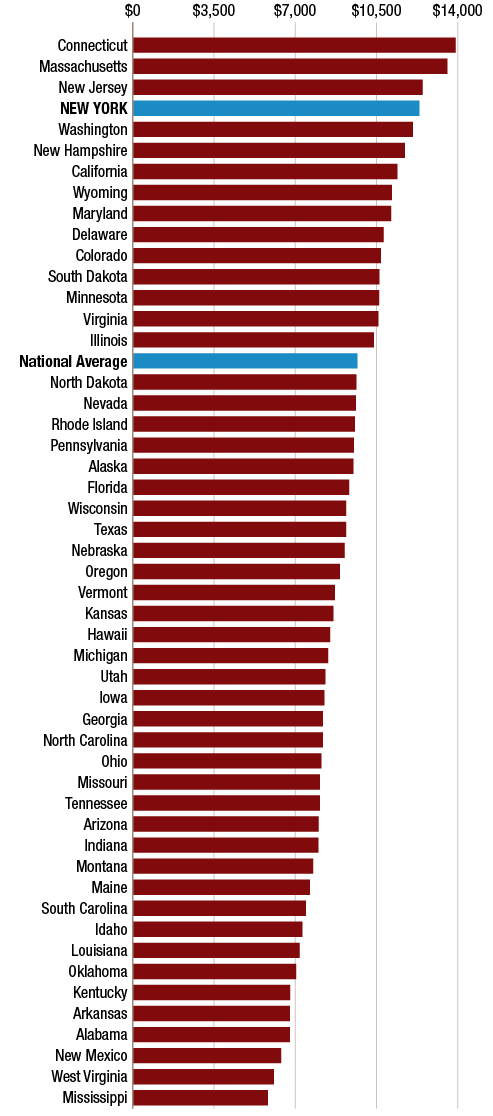
Note: Specific figures appear in Appendix A.
Individual Income Taxes
Individual income taxes made up $1.593 trillion, or 49.6 percent of all revenues paid by the states to the federal government in FFY 2020, and constituted the largest revenue category. New York’s payments of over $135 billion represented 8.5 percent of total federal receipts from individual income taxes. Total payments in this category from New York decreased by 11.0 percent, compared to a national decline of 6.4 percent.4
New York’s per capita individual income tax payments of $6,694 were more than 39 percent higher than the national average of $4,807. New York ranked third among the states in this category, with Connecticut first at $7,842. A breakdown of New York’s per capita tax payments relative to those made by other states, and to the national average, is shown in Figure 5.
FIGURE 5 - Federal Taxes Paid: New York and Nation, FFY 2020
| 50 States | New York | ||||||
| Total (millions) | Per Capita | Total (millions) | Share of Total | Per Capita | Rank (per capita) | ||
| Total (Taxes Paid) | $3,209,211 | $9,682 | $249,547 | 7.8% | $12,353 | 4 | |
| Individual Income | $1,593,397 | $4,807 | $135,226 | 8.5% | $6,694 | 3 | |
| Social Insurance | $1,301,606 | $3,927 | $91,669 | 7.0% | $4,538 | 9 | |
| Corporate Income | $211,828 | $639 | $17,054 | 8.1% | $844 | 3 | |
| Excise | $86,695 | $262 | $3,606 | 4.2% | $178 | 50 | |
| Estate and Gift | $15,685 | $47 | $1,992 | 12.7% | $99 | 3 | |
Social Insurance Taxes and Contributions
The second largest component of federal revenues provided by the states reflects payments for social insurance taxes and contributions.5 These totaled $1.302 trillion and accounted for 40.6 percent of total federal revenues. New Yorkers’ payments of $91.7 billion were 7 percent of the total federal receipts from social insurance taxes.
New York’s per capita contribution for such payments, $4,538, was 15.6 percent above the national average of $3,927, ranking it ninth among all states in this category. New Jersey made the highest per capita social insurance payments at $4,957, while Mississippi made the lowest at $2,878.
Corporate Income Tax and Other Taxes
Corporate income taxes made up 6.6 percent of total federal receipts in FFY 2020. An estimated 8.1 percent of this $212 billion total came from New York. Per capita corporate income taxes for New York were $844, which was $205 higher than the national per capita level of $639, placing New York third highest among the states.
Connecticut paid the most per capita in corporate income taxes, at $901, followed by Delaware and New York. New Mexico’s per capita corporate tax payments were the lowest among all states.
Other federal taxes include excise taxes on fuel, tobacco and alcohol, and estate and gift taxes. Approximately 4.2 percent of federal excise taxes, and 12.7 percent of federal estate and gift tax receipts, were from New York State. At $178 per capita, New York’s overall contribution for federal excise taxes was the lowest of all the states on a per capita basis. Wyoming paid the most in per capita excise taxes, more than twice New York’s amount. By contrast, New York’s per capita estate and gift tax payment of $99 was more than double the national average of $47. It ranked third in this measure, while Wyoming ranked first.
Federal Spending in the States
In 2020, the federal government spent over $6.55 trillion, including $6.2 trillion in expenditures that could be allocated among the states.6 A breakdown of overall FFY 2020 federal spending is shown in Figure 6.
FIGURE 6 - Federal Spending by Category in FFY 2020: $6.55 trillion
Note: Veterans’ service-connected compensation is included with Veterans Benefits, not Employee Retirement. “Excluded from Analysis” consists primarily of undistributed offsetting receipts, net interest on the federal government debt, and overseas procurement, along with expenditures in Puerto Rico and other outlying areas. Percentages may not add to 100 due to rounding.
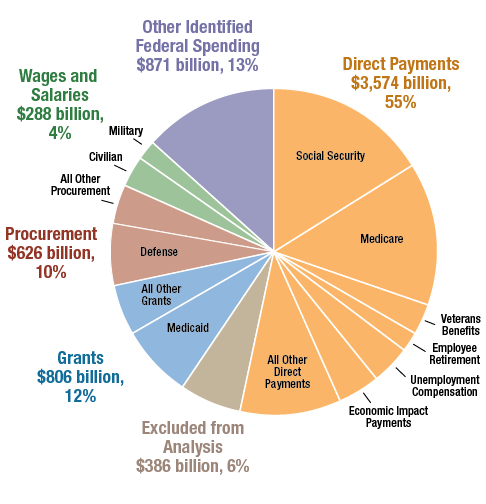
By far the largest category of federal expenditures was direct payments to or on behalf of individuals, which totaled over $3.57 trillion or 58 percent of federal spending allocated to the states in FFY 2020. This total is $1 trillion higher than in 2019. Social Security and Medicare represented approximately 55.5 percent of these direct payments in 2020. Spending for Unemployment Compensation and Economic Impact Payments during the COVID-19 pandemic represented over one-fifth together of such expenditures.
Grants to state and local governments was the third largest category. Medicaid made up over 56 percent of the total of $806 billion in such expenditures. Procurement was the fourth largest category, at $626 billion, while the fifth largest category, federal employee wages and salaries, totaled approximately $288 billion.
Another major federal budget category in FFY 2020 was “All Other” where total spending surged to $1.2 trillion due to emergency COVID relief and stimulus. The portion identified by this analysis, 76 percent, totaled $871 billion and is referred to in this report as Other Identified Federal Spending. It was the second largest category and represented approximately 13 percent of total expenditures in 2020.7 Federal spending for the Paycheck Protection Program and the Coronavirus Relief Fund comprised almost 78 percent of the total $871 billion. See section on Other Identified Federal Spending for more explanation.
As the recipient of $19,589 in per capita federal spending, New York ranked above two-thirds of the states, as illustrated in Figures 7 and 8. This amount was 5 percent higher than the national figure of $18,599 per capita. New York’s ranking rose to 17th among the states in FFY 2020 from 24th in 2019. The improvement was primarily due to increased federal grant and non-grant spending in the State in response to the COVID-19 pandemic (reported by the federal budget in the All Other category).
FIGURE 7 - Per Capita Federal Expenditures, FFY 2020
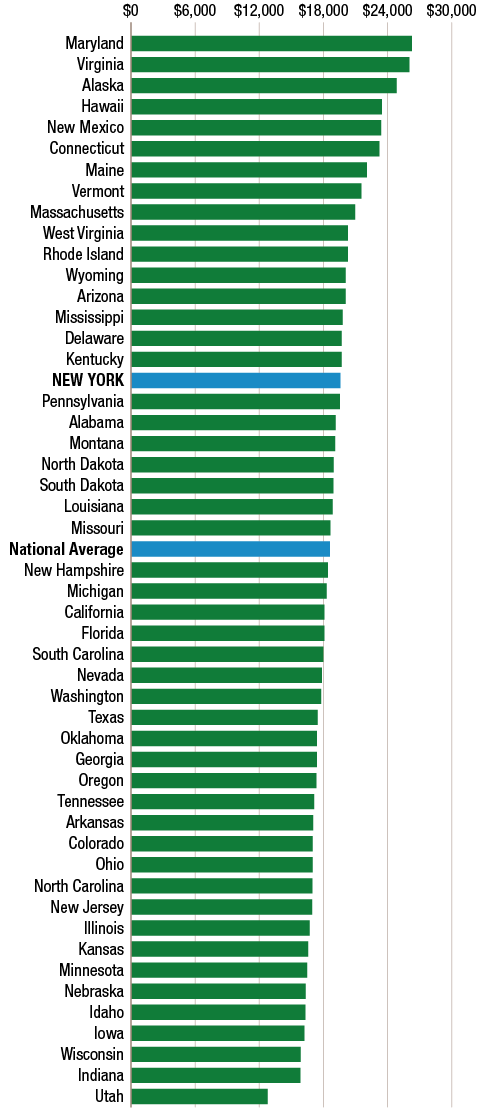
Note: Specific figures appear in Appendix A.
New York’s 6.4 percent share of total federal spending was modestly higher than its 6.1 percent share of the national population.
Maryland and Virginia ranked first and second among the states as the recipients of per capita federal expenditures of $26,281 and $26,040, or 41 and 40 percent higher than the nationwide average, respectively, primarily because of significantly higher-than-average spending on procurement and on wages and salaries. Per capita federal spending of $12,779 in Utah was the lowest in the country, 31.3 percent below the national average. Utah ranked last among the states on a per capita basis in direct payments and grants.
FIGURE 8 - Federal Spending by Major Category: New York and Nation, FFY 2020
| 50 States | New York | ||||||
| Total (millions) | Per Capita | Total (millions) | Share of Total | Per Capita | Rank (per capita) | ||
| Total | $6,164,535 | $18,599 | $395,716 | 6.4% | $19,589 | 17 | |
| Direct Payments | $3,573,757 | $10,782 | $228,288 | 6.4% | $11,301 | 17 | |
| Grants | $806,408 | $2,433 | $79,857 | 9.9% | $3,953 | 3 | |
| Procurement | $625,904 | $1,888 | $14,058 | 2.2% | $696 | 43 | |
| Wages and Salaries | $287,766 | $868 | $8,312 | 2.9% | $411 | 42 | |
| Other Identified Federal Spending | $870,699 | $2,627 | $65,200 | 7.5% | $3,228 | 14 | |
Direct Payments
As noted earlier, direct payments to or for individuals accounted for the largest component of federal government expenditures in the states—58 percent in 2020. The total spent in New York was $228.3 billion, or 6.4 percent of the nationwide total, larger than the State’s 5.8 percent share the year before, primarily due to the level of federally-funded benefits for unemployment compensation received in New York. This spending placed New York fourth highest for direct payments behind California, Texas and Florida.
Overall, in this category, per capita federal expenditures were modestly higher in New York than nationwide, with New York’s figure of $11,301 per capita falling 4.8 percent above the national average. A breakdown of federal direct payment expenditures by major category in New York and nationally is shown in Figure 9. West Virginia, Michigan and Pennsylvania received the highest per capita direct payments, while Utah received the lowest, followed by Texas.
FIGURE 9 - Federal Direct Payment Expenditures: New York and Nation, FFY 2020
| 50 States | New York | ||||||
| Total (millions) | Per Capita | Total (millions) | Share of Total | Per Capita | Rank (per capita) | ||
| Total | $3,573,757 | $10,782 | $228,288 | 6.4% | $11,301 | 17 | |
| Social Security | $1,073,497 | $3,239 | $64,612 | 6.0% | $3,198 | 38 | |
| Medicare | $910,793 | $2,748 | $59,722 | 6.6% | $2,956 | 16 | |
| Veterans Benefits Programs | $208,922 | $630 | $6,977 | 3.3% | $345 | 49 | |
| Federal Employee Retirement | $151,551 | $457 | $3,705 | 2.4% | $183 | 50 | |
| Supplemental Nutrition Assistance Program | $77,459 | $234 | $5,364 | 6.9% | $266 | 17 | |
| Refundable Earned Income Tax Credit | $57,540 | $174 | $3,274 | 5.7% | $162 | 23 | |
| Supplemental Security Income | $56,485 | $170 | $4,422 | 7.8% | $219 | 7 | |
| Unemployment Compensation | $465,835 | $1,405 | $47,356 | 10.2% | $2,344 | 2 | |
| Economic Impact Payments | $272,970 | $824 | $16,017 | 5.9% | $793 | 43 | |
| Direct Student Loan Costs | $112,632 | $340 | $7,071 | 6.3% | $350 | 19 | |
| All Other | $186,073 | $561 | $9,768 | 5.2% | $484 | 39 | |
Social Security
Social Security payments represented the largest component—30 percent—of direct payments to or for individuals. This proportion is 10 percent less than in the prior year due to the rise in temporary relief spending for businesses, individuals and households. The three major Social Security programs providing benefits to the aged, the disabled and their survivors totaled more than $1.07 trillion in payments in FFY 2020, close to the combined federal spending for grants and wages and salaries.
Per capita Social Security payments to New York were $3,198, just under the national average of $3,239. As with other per capita figures, this amount represents total Social Security payments divided by the State population, not average Social Security benefits per recipient. Differences among the states in per capita payments received for Social Security and other benefit programs reflect a mix of factors, including the proportion of the population eligible for benefits and the amount of benefits received by individual recipients, which may vary based on numerous criteria.
Delaware received the highest per capita Social Security payments at $4,231, which was 31 percent more than the national average. Utah received the lowest per capita payments in the country at $2,243, which was 31 percent below the national average.
Medicare
Nationwide expenditures for all Medicare programs totaled almost $911 billion in FFY 2020.
With $2,956 in per capita Medicare payments, New York received 7.6 percent more than the national average of $2,748 and ranked 16th among the states for such federal spending.
Florida received the highest per capita Medicare payments at $3,569, which was 30 percent higher than the national average. Utah and Alaska ranked lowest in this category at 42.6 and 35.5 percent below the national average, respectively.
Retirement Payments and Veterans Benefits
In FFY 2020, New York ranked the lowest of any state in receiving retirement payments to former federal civilian and military employees, and 49th for a range of veterans benefits, the same as in 2019.8
Nationwide, retirement payments to former federal workers made up 4.2 percent of direct payments, $151.6 billion, in FFY 2020. (Wages and salaries for current employees are reported in a separate category, as detailed later in this report.) In this category, per capita payments to New York were $183, less than half the national average of $457. Such per capita spending was highest in Maryland and Virginia, each of which received over three times the national per capita figure.
At $209 billion, veterans benefits represented 5.8 percent of direct payments nationwide. For New York, per capita benefits were $345, which is 45.2 percent less than the national average of $630 per capita. New Jersey, at $275, was the only state that received less per capita than New York in this category. By contrast, Alaska and West Virginia received per capita spending in this category that was significantly more than the national average, at 87.6 percent and 69.2 percent, respectively.
Pandemic Relief: Unemployment Compensation and Economic Impact Payments
In 2020, unemployment compensation delivered more than $47 billion in benefits to New Yorkers, or over 10 percent of federal nationwide payments for this purpose. This sum represented $2,344 per person, two-thirds above the national average of $1,405. Economic Impact Payments—stimulus checks to individuals and households, provided more than $16 billion to the State, or $793 per capita, modestly below the national average of $824. Costs for the federal government in 2020 resulting from instituting temporary waivers for the repayment of federal student loans, combined with the annual re-estimation of such loan expenses, totaled $112.6 billion, including over $7 billion in such costs related to New York borrowers. The per capita amount for this purpose, $350 per capita, was slightly higher than the national level. Finally, over $9 billion in Education Stabilization Fund non-grant payments resulted in an estimated $652 million for New York entities. This fund has provided additional funding for elementary, secondary and higher education purposes.
FIGURE 10 - Permanent Major Safety Net Spending, New York and National Average, FFY 2020
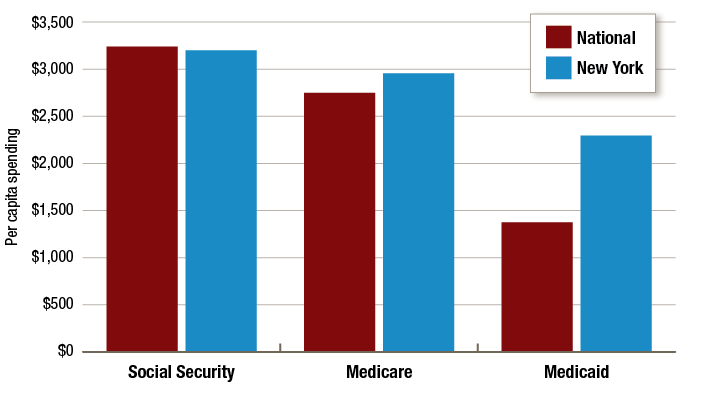
Social Security, Medicare and Medicaid are, by far, the three largest elements of the federal government’s permanent “safety net” expenditures. Figure 10 shows per capita spending on these programs in New York and nationally. Social Security paid $64.6 billion to New Yorkers in FFY 2020, more than any other permanent individual federal program, with per capita payments slightly lower than the national average. Medicare payments received in the State totaled just over $59.7 billion, and expenditures per capita in this category were 7.6 percent above the national average. The Medicaid program delivered almost $46.4 billion to New York in FFY 2020, with per capita expenditures 67 percent above the national average. (Medicaid is discussed in more detail below, in the Grants section.)
Grants
The federal government provided more than $806 billion in grants to state and local governments in FFY 2020. Medicaid was by far the largest grant program, representing 56.5 percent of this total. Spending on transportation was second largest, at 8.5 percent. Dozens of other grant programs that provide funding for services such as nutrition, housing, education, and family and children’s services make up the remainder of this category. New York ranked third among the states in per capita federal grants, at $3,953, or 62.5 percent above the national average, largely because of Medicaid and other safety net grants, which are discussed below. Figure 11 provides a breakdown of federal grant payments in New York and nationally.
FIGURE 11 - Federal Grants to State and Local Governments: New York and Nation, FFY 2020
| 50 States | New York | |||||
| Total (millions) | Per Capita | Total (millions) | Share of Total | Per Capita | Rank (per capita) | |
| Total | $806,408 | $2,433 | $79,857 | 9.9% | $3,953 | 3 |
| Medicaid | $455,674 | $1,375 | $46,360 | 10.2% | $2,295 | 2 |
| Transportation | $68,749 | $207 | $3,682 | 5.4% | $182 | 38 |
| Education | $42,862 | $129 | $2,960 | 6.9% | $147 | 14 |
| Other Safety Net | $140,323 | $423 | $19,426 | 13.8% | $962 | 1 |
| All Other | $98,799 | $298 | $7,430 | 7.5% | $368 | 8 |
The other four states in the top five for per capita federal grants all had much smaller populations than New York. These were Alaska, New Mexico, Louisiana and West Virginia, with Alaska and New Mexico ranked above New York. Utah, Florida and Georgia received the lowest per capita grant expenditures among the 50 states.
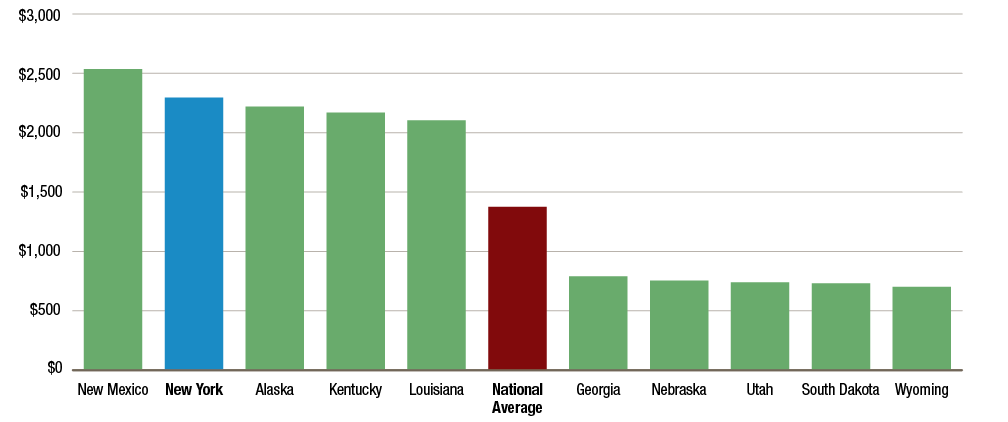
Medicaid
In FFY 2020, federal government spending on Medicaid in the 50 states was $455.7 billion. New York received close to $46.4 billion or $2,295 per capita, 67 percent more than the national average of $1,375, ranking it second among the states. New Mexico received the most per capita at $2,535, over 84 percent above the average. Such funding is based partly on the Federal Medical Assistance Percentage (FMAP), the level at which the federal government reimburses certain state Medicaid expenditures. FMAP is higher in states with relatively low per capita personal incomes and lower in states with higher personal incomes; both Alaska and New York have higher per capita incomes than most states and their FMAPs are at the lowest level, 50 percent. Despite its low FMAP, New York receives relatively high federal Medicaid funding per capita, as discussed below.
During the COVID-19 pandemic, federal relief legislation increased the FMAP received by all states by 6.2 percentage points due to the active declaration of a public health emergency.9 This level of reimbursement, or enhanced FMAP (eFMAP), has been available to states retroactive to January 1, 2020. FFY 2020 Medicaid disbursements to the states and territories by the federal government included $18.2 billion in such spending, including $1.7 billion in New York.
The overall level of Medicaid funding received by states from the federal government also reflects other factors. Among others, these include: the number of beneficiaries (New York has a higher proportion of its population enrolled in the program than most states); the breadth of benefits the state makes available (New York offers a wider range of benefits than most states); the costs of providing care (wages and certain other costs are generally higher in New York than in many other states); and special agreements called waivers in which the federal government may provide additional aid. Figure 12 shows the states with the highest and the lowest federal Medicaid spending per capita in FFY 2020.
FIGURE 12 - Per Capita Federal Medicaid Spending, Highest and Lowest Five States, FFY 2020
Aid for Transportation
Federal aid for transportation—highways, mass transit and airports—was the second largest grant category with $68.7 billion spent in FFY 2020. Federal spending on highways and mass transit is largely funded by the Highway Trust Fund, which raised $43.7 billion, primarily from the motor fuel tax, in FFY 2020.
Highway Trust Fund moneys are used both for highway and transit projects. Fund expenditures are distributed to states based on factors including lane miles and vehicle miles traveled, estimated fuel tax payments by highway users, and mass transit usage. Apart from this funding, federal pandemic relief legislation provided additional funds for transit and air transportation purposes in FFY 2020 as reviewed in the section Other Identified Federal Spending.
As shown in Figure 13, New York’s combined transportation grants were $182 per capita, below the national average of $207. The State ranked 50th in the nation for per capita federal highway funding ($72) but first for transit funding ($78). The federal government also provided more modest aid for airports. New York received $6 per capita in such funding. New York received $27 per capita in smaller grants administered by the Department of Transportation.
FIGURE 13 - Federal Transportation Grants: New York and Nation, FFY 2020
| 50 States | New York | |||||
| Total (millions) | Per Capita | Total (millions) | Share of Total | Per Capita | Rank (per capita) | |
| Total | $68,749 | $207 | $3,682 | 5.4% | $182 | 38 |
| Highways | $45,330 | $137 | $1,446 | 3.2% | $72 | 50 |
| Transit | $9,830 | $30 | $1,570 | 16.0% | $78 | 1 |
| Airports | $3,248 | $10 | $112 | 3.5% | $6 | 48 |
| All Other | $10,342 | $31 | $554 | 5.4% | $27 | 38 |
Aid for Education
The federal government spent $42.9 billion in FFY 2020 for elementary and secondary education for disadvantaged students (Elementary and Secondary Education Act or ESEA, Title 1), special education, education improvement programs and other purposes such as vocational rehabilitation, career education and the Education Stabilization Fund (over $2 billion) created by the CARES Act. As shown in Figure 14, New York received almost 7 percent of the total expenditures for these programs, similar to 2019, and ranked 14th as a recipient of overall per capita education spending.
Federal per capita spending for ESEA Title 1 in New York, at $57 per person, was 22.7 percent higher than the national average, placing New York seventh among all states. Federal aid to New York for special education was modestly above the national average on a per capita basis ($41 compared to $38).
FIGURE 14 - Federal Education Grants: New York and Nation, FFY 2020
| 50 States | New York | |||||
| Total (millions) | Per Capita | Total (millions) | Share of Total | Per Capita | Rank (per capita) | |
| Total | $42,862 | $129 | $2,960 | 6.9% | $147 | 14 |
| ESEA Title I | $15,378 | $46 | $1,150 | 7.5% | $57 | 7 |
| Special Education | $12,564 | $38 | $831 | 6.6% | $41 | 20 |
| Education Improvement | $4,458 | $13 | $309 | 6.9% | $15 | 18 |
| All Other | $10,461 | $32 | $670 | 6.4% | $33 | 21 |
Other Safety Net Spending
New York receives significant levels of grant funding for a range of safety net programs apart from the federal government’s spending for Medicaid.10 Apart from new programs created by federal pandemic relief legislation in FFY 2020, the federal government spent more than $140 billion in FFY 2020 for child nutrition, housing and heating, cash assistance and work supports, children’s and others’ health, and child and family services such as Head Start.
For these other safety net programs collectively, New York received 13.8 percent of national expenditures, as shown in Figure 15. Per capita spending for the State in this category, $962, was more than twice the national average of $423 and ranked New York first for such spending. New York was followed by Massachusetts, California and Minnesota, while per capita spending was the lowest in Idaho and Utah.
FIGURE 15 - Federal Safety Net Grant Spending Other Than Medicaid: New York and Nation, FFY 2020
| 50 States | New York | |||||
| Total (millions) | Per Capita | Total (millions) | Share of Total | Per Capita | Rank (per capita) | |
| Total | $140,323 | $423 | $19,426 | 13.8% | $962 | 1 |
| Housing | $30,710 | $93 | $4,580 | 14.9% | $227 | 1 |
| Child Nutrition | $22,585 | $68 | $1,472 | 6.5% | $73 | 17 |
| Children’s Health Insurance | $16,563 | $50 | $1,496 | 9.0% | $74 | 7 |
| TANF | $16,476 | $50 | $2,637 | 16.0% | $131 | 1 |
| Child and Family Services | $11,469 | $35 | $778 | 6.8% | $39 | 19 |
| Basic Health Plan | $7,072 | $21 | $6,086 | 86.1% | $301 | 1 |
| All Other | $35,450 | $107 | $2,378 | 6.7% | $118 | 12 |
Within this category, federal expenditures for housing and the Temporary Assistance for Needy Families (TANF) block grant program represented 34 percent of total spending. New York received the highest per capita expenditures among the states for housing and TANF, at $227 and $131, respectively. These amounts were more than double the national averages, with each area representing 15 percent or more of national spending.
The Affordable Care Act authorizes states to establish a Basic Health Program (known in New York as the Essential Plan), a low-cost health insurance option for individuals who meet certain income and other requirements. In 2015, New York joined Minnesota as one of only two states in the nation to establish such a program. This program has provided an important source of federal aid to New York. New York’s share of nationwide funding in this area for FFY 2020 was over 86 percent of the total, or $6.1 billion. Minnesota received the remainder of the funding.
For the $23 billion Child Nutrition category that includes programs such as School Breakfast and School Lunch, New York received per capita payments slightly above the national average ($73 compared to $68).
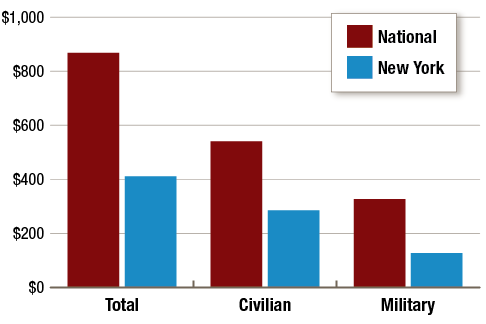
Procurement
The federal government spent an estimated $625.9 billion in FFY 2020 to purchase services and goods in the 50 states and Washington, D.C.11 The Department of Defense was the source of almost 63 percent of such procurement spending. The departments of Health and Human Services, Veterans Affairs and Energy were the next largest sources of such federal procurement spending.
With $696 in per capita procurement spending overall, 36.9 percent of the national average as seen in Figure 16, New York ranked 43rd among the states. Department of Defense procurement spending was $410 per person in New York, compared to a national average of $1,189. Virginia received the highest total procurement spending from the federal government at $68.4 billion, and the highest per capita amount for procurement at $7,927, followed by Maryland at $7,028.
FIGURE 16 - Per Capita Federal Procurement Spending, FFY 2020
Wages and Salaries
Spending on federal employee wages and salaries throughout the nation totaled $287.8 billion, for a per capita national average of $868 in FFY 2020.12 Federal government spending on civilian pay was $179.4 billion, or 62.3 percent of the total, and spending on military salaries was $108.4 billion, or 37.7 percent.
In New York, $8.3 billion was spent on federal employee wages and salaries, 2.9 percent of the national total. This included $5.8 billion for civilian pay ($285 per capita, as shown in Figure 17) and $2.6 billion for military pay ($127 per capita). Overall, per capita expenditures in the State for wages and salaries, approximately $411, were 52.6 percent below the national level and ranked New York 42nd among all states.
FIGURE 17 - Per Capita Spending for Federal Wages and Salaries, FFY 2020
Other Identified Federal Spending
Non-defense spending not directly or currently reported by the federal government as payments for individuals, grants to state and local governments, other grants, or net interest and certain offsetting receipts is placed in the federal budget’s “All Other” category. In 2019, the total of such spending was $203 billion. In FFY 2020, it was $1.15 trillion, more than four-and-a-half times larger than in 2019 due to large-scale spending in response to the COVID-19 pandemic that was reported in this category.
Figure 18 shows the composition of over $870 billion in this category that has been identified by this analysis and allocated to the 50 states and the District of Columbia.13 These amounts represent spending under new programs established by the federal CARES Act, spending for pandemic relief purposes through existing programs and non-relief-related spending in existing programs where the increase was significant in 2020 compared to the prior year (e.g., Refundable Corporate Income Tax Credit).
FIGURE 18 - Other Identified Federal Spending: New York and Nation, FFY 2020
| 50 States | New York | ||||||
| Total (millions) | Per Capita | Total (millions) | Share of Total | Per Capita | Rank (per capita) | ||
| Total | $870,699 | $2,627 | 65,200 | 7.5% | $3,228 | 14 | |
| Business Loans Account (PPP) | $531,525 | $1,604 | 39,345 | 7.4% | $1,948 | 4 | |
| Coronavirus Relief Fund | $146,829 | $443 | 7,940 | 5.4% | $393 | 49 | |
| Healthcare Provider Relief Funds | $79,113 | $239 | 9,118 | 11.5% | $451 | 3 | |
| EIDL Advances and Loans | $44,503 | $134 | 3,579 | 8.0% | $177 | 5 | |
| Air Carrier Worker Support | $28,135 | $85 | 1,629 | 5.8% | $81 | 8 | |
| Corporate Income Tax Credit (refundable portion only) | $15,929 | $48 | 1,282 | 8.1% | $63 | 3 | |
| Transit Infrastructure Grants | $12,095 | $36 | 2,029 | 16.8% | $100 | 1 | |
| All Other | $12,569 | $38 | 280 | 2.2% | $14 | 39 | |
Note: PPP is the Paycheck Protection Program and EIDL is an Economic Injury Disaster Loan.
New York’s share of national spending in this category was 7.5 percent; per capita spending in the State was $3,228, 23 percent higher than the national average, ranking it 14th among all states. Such spending contributed significantly to New York’s rise in the balance of payments ranking from 49th in 2019 to 40th in 2020. States with smaller populations received the most per capita spending—North Dakota, Wyoming, South Dakota, Vermont and Alaska ranked at the top—and middle-size states received the least, with South Carolina, North Carolina, Arizona, Arkansas and Kentucky ranked the lowest.
With the exception of the Coronavirus Relief Fund, New York received above or close to the same amount as the national average in per capita spending for the specific programs noted above. Not surprisingly, spending per capita for transit relief was almost three times the national average, ranking New York first. New York also received 89 percent more per capita than the nationwide average in spending through the various healthcare provider relief funds, ranking it third. In this subcategory, Nevada and Maine received more than New York and Utah ranked last.
Under the CARES Act Paycheck Protection Program (PPP) that provided forgivable loans to small businesses for use in payroll and other operating costs, New York received $1,948 per capita, over a fifth more than the national average, ranking it fourth among all states. North Dakota, Massachusetts and Minnesota received more per capita than New York. Similarly, such pandemic relief spending in New York for Economic Injury Disaster Loans (EIDLs) and related advances was 32 percent more than nationwide, ranking the State fifth overall. For two other programs that provided business support, Air Carrier Worker Support under the CARES Act and the refundable portion of the Corporate Income Tax Credit, New York ranked eighth and third, respectively. At $63 per capita for the latter, New York received almost a third more than the national average. Total outlays for this purpose have grown significantly since the enactment in December 2017 of the Tax Cuts and Jobs Act (TCJA), from $1.1 billion in 2018 to $16.1 billion in 2020 (the $15.9 billion amount in Figure 18 above reflects spending in the 50 states and D.C. only).
The share of Coronavirus Relief Fund spending for states and local governments received in New York, 5.4 percent, was less than its share of national population in 2020, 6.1 percent. (Figure 11 includes administration costs distributed across recipients.) The $393 spent by this program on a per capita basis in New York was $50 less than the $443 national average, ranking the State 49th overall. New Jersey ranked 50th while Alabama, Maryland and Massachusetts fell just ahead of New York. Wyoming, Vermont and Alaska each received over 300 percent more than the national level.
The Federal Budget Deficit
The figures presented in this report are based on actual expenditures and revenues as reported by the federal government, with certain estimates and adjustments by the Office of the State Comptroller. Such figures reflect the budgetary imbalance associated with the federal budget deficit, which was $3.13 trillion in FFY 2020. The federal deficit results from expenditures ($6.55 trillion in FFY 2020) exceeding revenues received the same year ($3.4 trillion), with the difference generally financed by borrowing that will be repaid in future years.
Federal budget deficits (or surpluses) shift over time depending on many factors, including changes in the economy and policy actions that affect levels of spending and revenues. The deficit for 2020 was more than three times higher than the $984 billion deficit in 2019 due to the large-scale federal relief and stimulus in response to the COVID-19 pandemic, along with continuing impacts from the Tax Cuts and Jobs Act and certain other spending changes. For FFY 2021, the actual deficit is $2.78 billion, moderately below the deficit in 2020. The Congressional Budget Office has forecast that the deficit will decrease in 2022 through 2024 but start to increase again in 2025, averaging $1.2 trillion from 2022 through 2031. If Congress takes action in coming years to align federal spending more closely with revenues, state-by-state impacts will depend in part on particular policy choices. For example, reductions in the defense budget would be expected to affect other states more than New York, while increases in federal income taxes, particularly for upper-income earners, could have a disproportionate impact on New York.
Assessing New York State’s Balance of Payments
Apart from the impacts of federal government spending in response to the COVID-19 pandemic, consideration of the balance of payments between New York (or any state) and the federal government often leads to questions regarding whether the State is receiving and paying its “fair share.” While the distribution of federal tax liability and spending is clearly unequal among the states, whether it is equitable is open to interpretation.
In FFY 2020, New York was home to 6.1 percent of the U.S. population, and received 6.4 percent of the federal spending that was allocated among the states. As a result, its per capita share of federal spending was above the national average. As shown earlier in this report, in some categories such as certain relief programs, Medicaid grants and funding for mass transit, New York received comparatively high levels of federal spending; in others, such as the military budget and highway aid, the State’s share was proportionally less than in most states. On the revenue side of the federal budget, tax receipts generated within New York were significantly higher than the national per capita average—largely because of individual income taxes, where New York’s per capita payment was higher than that of 47 other states. The bottom line: federal relief spending in 2020 meant that New York, like all the states, got more than it gave this year. As temporary spending by the federal government expires, the previous trend shaping the balance of payments for New York State will likely reassert itself.
While a state’s population obviously influences the level of its payments to and from the federal government, a variety of economic, demographic and other factors also affect the levels of funding analyzed in this report. These include:
- Numbers of individuals in certain age groups, such as those eligible for Medicare because they are 65 or older.
- Numbers of state residents living in poverty or within a certain multiple of the federal poverty level.
- Personal income levels, which affect the distribution of funding for a variety of programs.
- State policy choices. Numerous federal programs provide resources to support initiatives that are partly state-financed, so that state activities affect the flow of federal funds.
New York’s per capita share of federal spending in FFY 2020 was higher than in 2019, 6.4 percent compared to 5.9 percent. The State’s per capita contribution to federal revenues continues to be among the highest in the nation, even though its share of total revenues has declined modestly. Almost half of federal revenues came from the individual income tax, where New York’s share was 8.5 percent. The latter reflects the interplay of comparatively higher incomes in New York and a progressive federal income tax, with marginal rates in 2020 ranging from 10 percent up to 37 percent. New York’s comparatively high share of the nation’s high-income residents drives comparatively high levels of federal income tax payments from New York.
Overall, New York’s share of federal tax revenues, 7.8 percent, appears high if compared to the State’s 6.1 percent of the nation’s population. Total federal tax payments averaged $9,682 for every U.S. resident in FFY 2020, but were more than 25 percent higher, at $12,353 per capita, in New York. Comparing tax revenues in the context of the states’ personal income levels offers a different perspective. New York generated 7.4 percent of U.S. personal income in 2020. That proportion was closer to New York’s share of federal tax revenues, although still lower.
Differences in the cost of living among states may affect the bottom-line impact of both federal expenditures and taxes. For example, individuals with income of $50,000 may pay a similar level of federal taxes regardless of where they live, but their purchasing power may vary widely depending on which region of the country or part of a state they have chosen to reside in.
Conclusion
In the spirit of the reports on “The Federal Budget and the States” published over many years by the late Senator Daniel Patrick Moynihan, this report seeks to inform debate over the federal government’s relationship with New York, and with the states in general, by comparing federal spending, federal taxes paid, and the resulting balance of payments in New York and the other states. Apart from the temporary impacts of federal spending in response to COVID-19, the imbalance between taxes paid by New Yorkers to the federal government and moneys received in return through federal spending may raise questions about fiscal equity. Certainly, the impacts of the pandemic on state economies and budgets have highlighted the significant role the federal budget plays in the fiscal condition of New York and all the states.
In the New York State Budget, federal receipts now represent over one-third of all revenue received by the State. Millions of New Yorkers rely on Social Security as a staple of household income, on Medicare and/or Medicaid for essential health care, and on the Supplemental Nutrition Assistance Program for basic food needs. In education alone, federal grants provide important support for services to children with disabilities or limited English proficiency, breakfast and lunch programs, and college loans, as well as other programs. Other federal funds pay for essential capital projects and services (such as highway and mass transit construction and maintenance), housing, job training, environmental protection, public safety initiatives and far more. These regular spending streams are distinct from the emergency support provided to states and localities, and to individuals, households and businesses through federal assistance designed to address the needs resulting from the COVID-19 pandemic.
As this report has shown, New Yorkers are directly and sometimes profoundly affected by many aspects of the federal budget. The debate in Washington must be informed by a careful consideration of the fiscal and human impacts of current federal policies, as well as any potential changes to be made going forward.
Footnotes
1 References to the states as a group in this report include the District of Columbia, unless otherwise noted. For data consistency, national totals and averages in this report include expenditures in and revenues from the District of Columbia in addition to the states. However, because it is an outlier in many categories, the District of Columbia is not included in the rankings of the states. Rankings and figures in tables, charts and text in this report and related materials are based on unrounded amounts.
2 Customs duties and fees (including tariffs) and miscellaneous receipts, such as deposits of earnings by the Federal Reserve, are excluded from revenues. Undistributed offsetting receipts, net interest on the federal government debt, spending for international affairs and overseas procurement (military- and non-military-related) and unidentified spending represent most of the outlays excluded from this analysis. Receipts from and outlays to Puerto Rico and other outlying areas are also excluded. See Appendix B: Methodology.
3 For more detailed figures, see https://www.osc.state.ny.us/files/reports/budget/2020/excel/federal-budget-fiscal-year-2020.xlsx.
4 For purposes of this report, allocations of individual taxes are based on liability reported on 2019 federal income tax returns. (Federal tax years are calendar years; for example, tax year 2019 was January 1 through December 31, 2019.) Individual income tax collections during the fiscal year (FFY 2020 was October 1, 2019 through September 30, 2020) include withholding and estimated tax payments on income partially incurred in calendar year 2020, reflecting economic changes such as those in wages, other non-wage income and employment.
5 Social insurance taxes and contributions include: (1) FICA (the Federal Insurance Contributions Act tax), withheld for Social Security and Medicare; (2) SECA (the Self-Employment Contributions Act tax), paid by self-employed small business owners on their net earnings to cover their Social Security, Medicare, and Old-Age, Survivors and Disability Insurance (OASDI) costs; (3) FUTA (the Federal Unemployment Tax Act tax), withheld for unemployment compensation; (4) RRA and the RUIA (the Railroad Retirement Act and the Railroad Unemployment Insurance Act taxes), used in place of FICA, SECA and FUTA for railroad employees; and (5) other receipts, primarily pension contributions from federal employees.
6 See footnote 2 and Appendix B for a description of outlays which are excluded from this analysis.
7 Total spending reported by the federal budget for this category in FFY 2020 was $1.15 trillion. Not all of “All Other” spending was emergency-related and not all emergency COVID spending was classed in this category. The identification of program or account outlays in “All Other” that comprise the portion analyzed by this report was determined through use of federal budget tables and materials. Some spending occurred outside of the 50 states and the District of Columbia.
8 Veterans benefits include: (1) payments for service-connected disability; (2) payments for non-service-connected disability; (3) educational and training services; and (4) hospital and medical care.
9 See the federal Families First Coronavirus Response Act, signed into law on March 18, 2020, and the Centers for Medicare and Medicaid Services at https://www.medicaid.gov/medicaid/financial-management/state-budget-expenditure-reporting-for-medicaid-and-chip/expenditure-reports-mbescbes/medicaid-cms-64-ffcra-increased-fmap-expenditure-data-collected-through-mbes/index.html.
10 Programs included in the categories represented in Figure 15 are: Housing: Section 8 Rental Assistance, Public Housing Capital and Operating Funds; Child Nutrition: School Lunch, School Breakfast, Summer Food and other programs; Child and Family Services: Head Start, Community Services Block Grant and other programs; All Other: Adoption and Foster Care Payments, Special Supplemental Nutrition Program for Women, Infants and Children, Low-Income Home Energy Assistance, Child Care and Development Block Grant and other programs.
11 This amount does not include $31.9 billion in such spending in other countries. (As elsewhere in this analysis, it also does not include $2.6 billion in expenditures in Puerto Rico and other outlying areas.)
12 This figure represents direct obligations for wages and salaries. While such payments may also be made through reimbursable obligations, this analysis does not include those amounts in its figures for wages and salaries, since reimbursable obligations represent spending accounted for elsewhere in the federal budget. Direct obligations are financed from appropriations and reimbursable obligations are financed from offsetting collections that come from federal and non-federal sources.
13 The remainder of “All Other” is unidentified and part of the total $386 billion that is excluded in this analysis. See footnote 2 and Figure 6.
Appendix A: Federal Revenues and Expenditures by State
Balance of Payments (Expenditures Minus Revenues), FFY 2020
| Total (millions) | Per Capita | Variation from National Per Capita |
Percentage Variation from National Per Capita |
Rank (per capita) | |
|---|---|---|---|---|---|
| National: 50 States & D.C. | $2,955,323 | $8,916 | |||
| Alabama | $62,185 | $12,377 | $3,461 | 38.8% | 11 |
| Alaska | $11,250 | $15,340 | $6,423 | 72.0% | 3 |
| Arizona | $86,234 | $12,058 | $3,142 | 35.2% | 12 |
| Arkansas | $30,884 | $10,255 | $1,339 | 15.0% | 19 |
| California | $264,998 | $6,702 | ($2,214) | -24.8% | 42 |
| Colorado | $36,389 | $6,303 | ($2,614) | -29.3% | 46 |
| Connecticut | $33,665 | $9,336 | $420 | 4.7% | 22 |
| Delaware | $8,816 | $8,905 | ($11) | -0.1% | 28 |
| Florida | $188,851 | $8,768 | ($148) | -1.7% | 31 |
| Georgia | $98,562 | $9,201 | $285 | 3.2% | 24 |
| Hawaii | $21,782 | $14,968 | $6,051 | 67.9% | 5 |
| Idaho | $16,561 | $9,005 | $89 | 1.0% | 26 |
| Illinois | $80,992 | $6,321 | ($2,595) | -29.1% | 45 |
| Indiana | $53,247 | $7,847 | ($1,069) | -12.0% | 38 |
| Iowa | $25,398 | $7,961 | ($956) | -10.7% | 36 |
| Kansas | $23,276 | $7,923 | ($994) | -11.1% | 37 |
| Kentucky | $58,185 | $12,913 | $3,997 | 44.8% | 9 |
| Louisiana | $54,395 | $11,678 | $2,762 | 31.0% | 13 |
| Maine | $19,647 | $14,422 | $5,505 | 61.7% | 6 |
| Maryland | $93,533 | $15,142 | $6,225 | 69.8% | 4 |
| Massachusetts | $52,158 | $7,419 | ($1,497) | -16.8% | 39 |
| Michigan | $99,594 | $9,883 | $967 | 10.8% | 21 |
| Minnesota | $33,421 | $5,857 | ($3,060) | -34.3% | 47 |
| Mississippi | $41,388 | $13,976 | $5,060 | 56.7% | 8 |
| Missouri | $65,144 | $10,584 | $1,668 | 18.7% | 16 |
| Montana | $12,284 | $11,330 | $2,413 | 27.1% | 14 |
| Nebraska | $14,118 | $7,197 | ($1,719) | -19.3% | 41 |
| Nevada | $25,571 | $8,236 | ($680) | -7.6% | 35 |
| New Hampshire | $9,207 | $6,684 | ($2,233) | -25.0% | 43 |
| New Jersey | $41,369 | $4,454 | ($4,463) | -50.1% | 50 |
| New Mexico | $35,996 | $16,999 | $8,083 | 90.7% | 1 |
| NEW YORK | $146,168 | $7,236 | ($1,681) | -18.9% | 40 |
| North Carolina | $91,589 | $8,773 | ($143) | -1.6% | 30 |
| North Dakota | $7,265 | $9,325 | $409 | 4.6% | 23 |
| Ohio | $104,499 | $8,856 | ($60) | -0.7% | 29 |
| Oklahoma | $40,998 | $10,355 | $1,438 | 16.1% | 18 |
| Oregon | $35,626 | $8,408 | ($509) | -5.7% | 32 |
| Pennsylvania | $130,367 | $10,026 | $1,110 | 12.4% | 20 |
| Rhode Island | $11,751 | $10,708 | $1,792 | 20.1% | 15 |
| South Carolina | $53,917 | $10,534 | $1,618 | 18.1% | 17 |
| South Dakota | $7,368 | $8,309 | ($607) | -6.8% | 33 |
| Tennessee | $62,742 | $9,079 | $162 | 1.8% | 25 |
| Texas | $241,184 | $8,275 | ($641) | -7.2% | 34 |
| Utah | $14,642 | $4,475 | ($4,441) | -49.8% | 49 |
| Vermont | $8,248 | $12,826 | $3,910 | 43.9% | 10 |
| Virginia | $133,444 | $15,460 | $6,544 | 73.4% | 2 |
| Washington | $44,026 | $5,714 | ($3,203) | -35.9% | 48 |
| West Virginia | $25,474 | $14,202 | $5,285 | 59.3% | 7 |
| Wisconsin | $39,318 | $6,671 | ($2,245) | -25.2% | 44 |
| Wyoming | $5,143 | $8,915 | ($1) | 0.0% | 27 |
| District of Columbia | $52,457 | $76,075 | $67,159 | 753.2% |
Note: Does not include spending in or taxes from Puerto Rico and other outlying areas.
Taxes Paid to the Federal Government, FFY 2020
| Total (millions) | Per Capita | Variation from National Per Capita |
Percentage Variation from National Per Capita |
Rank (per capita) | |
|---|---|---|---|---|---|
| National: 50 States & D.C. | $3,209,211 | $9,682 | |||
| Alabama | $34,030 | $6,773 | ($2,909) | -30.0% | 47 |
| Alaska | $6,970 | $9,504 | ($178) | -1.8% | 20 |
| Arizona | $57,285 | $8,010 | ($1,672) | -17.3% | 37 |
| Arkansas | $20,404 | $6,775 | ($2,907) | -30.0% | 46 |
| California | $450,766 | $11,401 | $1,718 | 17.7% | 7 |
| Colorado | $61,710 | $10,688 | $1,006 | 10.4% | 11 |
| Connecticut | $50,167 | $13,912 | $4,230 | 43.7% | 1 |
| Delaware | $10,697 | $10,806 | $1,123 | 11.6% | 10 |
| Florida | $200,848 | $9,325 | ($357) | -3.7% | 21 |
| Georgia | $87,800 | $8,196 | ($1,486) | -15.3% | 32 |
| Hawaii | $12,378 | $8,505 | ($1,177) | -12.2% | 28 |
| Idaho | $13,439 | $7,307 | ($2,375) | -24.5% | 42 |
| Illinois | $133,112 | $10,389 | $707 | 7.3% | 15 |
| Indiana | $54,274 | $7,999 | ($1,684) | -17.4% | 38 |
| Iowa | $26,353 | $8,260 | ($1,422) | -14.7% | 31 |
| Kansas | $25,401 | $8,646 | ($1,036) | -10.7% | 27 |
| Kentucky | $30,575 | $6,786 | ($2,897) | -29.9% | 45 |
| Louisiana | $33,504 | $7,193 | ($2,489) | -25.7% | 43 |
| Maine | $10,407 | $7,639 | ($2,044) | -21.1% | 40 |
| Maryland | $68,808 | $11,139 | $1,457 | 15.0% | 9 |
| Massachusetts | $95,308 | $13,558 | $3,875 | 40.0% | 2 |
| Michigan | $84,843 | $8,419 | ($1,263) | -13.0% | 29 |
| Minnesota | $60,578 | $10,616 | $933 | 9.6% | 13 |
| Mississippi | $17,242 | $5,822 | ($3,860) | -39.9% | 50 |
| Missouri | $49,637 | $8,065 | ($1,618) | -16.7% | 35 |
| Montana | $8,432 | $7,777 | ($1,905) | -19.7% | 39 |
| Nebraska | $17,919 | $9,135 | ($547) | -5.7% | 24 |
| Nevada | $29,865 | $9,620 | ($63) | -0.6% | 17 |
| New Hampshire | $16,150 | $11,724 | $2,042 | 21.1% | 6 |
| New Jersey | $116,013 | $12,489 | $2,807 | 29.0% | 3 |
| New Mexico | $13,547 | $6,398 | ($3,285) | -33.9% | 48 |
| NEW YORK | $249,547 | $12,353 | $2,671 | 27.6% | 4 |
| North Carolina | $85,548 | $8,195 | ($1,488) | -15.4% | 33 |
| North Dakota | $7,511 | $9,641 | ($42) | -0.4% | 16 |
| Ohio | $95,909 | $8,128 | ($1,554) | -16.1% | 34 |
| Oklahoma | $27,895 | $7,045 | ($2,637) | -27.2% | 44 |
| Oregon | $37,836 | $8,929 | ($753) | -7.8% | 25 |
| Pennsylvania | $123,866 | $9,526 | ($156) | -1.6% | 19 |
| Rhode Island | $10,503 | $9,571 | ($111) | -1.1% | 18 |
| South Carolina | $38,189 | $7,461 | ($2,221) | -22.9% | 41 |
| South Dakota | $9,419 | $10,623 | $941 | 9.7% | 12 |
| Tennessee | $55,718 | $8,062 | ($1,620) | -16.7% | 36 |
| Texas | $267,944 | $9,193 | ($489) | -5.1% | 23 |
| Utah | $27,166 | $8,304 | ($1,379) | -14.2% | 30 |
| Vermont | $5,605 | $8,716 | ($967) | -10.0% | 26 |
| Virginia | $91,321 | $10,580 | $898 | 9.3% | 14 |
| Washington | $93,001 | $12,070 | $2,387 | 24.7% | 5 |
| West Virginia | $10,917 | $6,087 | ($3,596) | -37.1% | 49 |
| Wisconsin | $54,213 | $9,198 | ($484) | -5.0% | 22 |
| Wyoming | $6,442 | $11,168 | $1,486 | 15.3% | 8 |
| District of Columbia | $12,200 | $17,693 | $8,011 | 82.7% |
Note: Does not include taxes paid from Puerto Rico and other outlying areas.
Federal Taxes by Category, FFY 2020 (millions)
| Income Tax Less Refunds |
Social Insurance | Corporate | Excise | Estate and Gift | |
|---|---|---|---|---|---|
| National: 50 States & D.C. | $1,593,397 | $1,301,606 | $211,828 | $86,695 | $15,685 |
| Alabama | $14,292 | $15,797 | $2,354 | $1,464 | $123 |
| Alaska | $3,461 | $2,989 | $275 | $228 | $18 |
| Arizona | $27,348 | $24,741 | $3,204 | $1,833 | $159 |
| Arkansas | $8,302 | $9,634 | $1,496 | $902 | $71 |
| California | $242,391 | $166,190 | $30,381 | $8,474 | $3,331 |
| Colorado | $31,757 | $24,465 | $3,438 | $1,732 | $317 |
| Connecticut | $28,279 | $17,744 | $3,250 | $734 | $159 |
| Delaware | $5,447 | $4,090 | $866 | $259 | $35 |
| Florida | $111,352 | $73,118 | $8,614 | $5,755 | $2,009 |
| Georgia | $39,810 | $38,178 | $6,414 | $3,134 | $264 |
| Hawaii | $5,624 | $5,894 | $458 | $384 | $18 |
| Idaho | $6,032 | $6,153 | $728 | $472 | $53 |
| Illinois | $67,262 | $52,780 | $9,417 | $3,265 | $388 |
| Indiana | $22,191 | $24,806 | $5,139 | $1,980 | $159 |
| Iowa | $10,833 | $12,118 | $2,425 | $959 | $18 |
| Kansas | $11,131 | $11,471 | $1,985 | $725 | $88 |
| Kentucky | $12,536 | $14,076 | $2,379 | $1,442 | $141 |
| Louisiana | $14,384 | $14,638 | $3,104 | $1,325 | $53 |
| Maine | $4,722 | $4,724 | $578 | $365 | $18 |
| Maryland | $33,916 | $30,373 | $2,904 | $1,386 | $229 |
| Massachusetts | $53,626 | $34,075 | $5,731 | $1,471 | $405 |
| Michigan | $38,231 | $37,857 | $5,947 | $2,579 | $229 |
| Minnesota | $27,849 | $26,583 | $4,523 | $1,536 | $88 |
| Mississippi | $6,567 | $8,523 | $1,174 | $977 | $0 |
| Missouri | $22,264 | $21,722 | $3,427 | $2,047 | $176 |
| Montana | $3,862 | $3,849 | $362 | $360 | $0 |
| Nebraska | $7,239 | $8,601 | $1,395 | $596 | $88 |
| Nevada | $17,386 | $9,973 | $1,390 | $993 | $123 |
| New Hampshire | $8,142 | $6,652 | $881 | $422 | $53 |
| New Jersey | $61,443 | $46,043 | $6,239 | $2,059 | $229 |
| New Mexico | $6,095 | $6,231 | $567 | $637 | $18 |
| NEW YORK | $135,226 | $91,669 | $17,054 | $3,606 | $1,992 |
| North Carolina | $38,239 | $37,175 | $6,840 | $3,047 | $247 |
| North Dakota | $3,380 | $3,340 | $410 | $328 | $53 |
| Ohio | $43,124 | $40,989 | $8,493 | $3,074 | $229 |
| Oklahoma | $12,166 | $12,860 | $1,619 | $1,198 | $53 |
| Oregon | $17,405 | $16,352 | $2,716 | $1,099 | $264 |
| Pennsylvania | $58,499 | $53,152 | $8,507 | $3,143 | $564 |
| Rhode Island | $5,082 | $4,575 | $592 | $219 | $35 |
| South Carolina | $17,180 | $16,889 | $2,462 | $1,535 | $123 |
| South Dakota | $4,965 | $3,572 | $557 | $290 | $35 |
| Tennessee | $25,005 | $24,703 | $3,847 | $2,040 | $123 |
| Texas | $133,334 | $105,649 | $18,914 | $8,954 | $1,093 |
| Utah | $12,751 | $11,687 | $1,893 | $799 | $35 |
| Vermont | $2,588 | $2,553 | $266 | $163 | $35 |
| Virginia | $44,483 | $39,502 | $4,554 | $2,464 | $317 |
| Washington | $47,818 | $36,271 | $6,375 | $1,709 | $828 |
| West Virginia | $4,319 | $5,346 | $590 | $628 | $35 |
| Wisconsin | $24,317 | $23,801 | $4,276 | $1,536 | $282 |
| Wyoming | $3,491 | $2,211 | $232 | $279 | $229 |
| District of Columbia | $6,251 | $5,225 | $585 | $87 | $53 |
Note: Does not include taxes paid from Puerto Rico and other outlying areas.
Expenditures by the Federal Government, FFY 2020
| Total (millions) | Per Capita | Variation from National Per Capita |
Percentage Variation from National Per Capita |
Rank (per capita) | |
|---|---|---|---|---|---|
| National: 50 States & D.C. | $6,164,535 | $18,599 | |||
| Alabama | $96,215 | $19,150 | $551 | 3.0% | 19 |
| Alaska | $18,220 | $24,844 | $6,245 | 33.6% | 3 |
| Arizona | $143,519 | $20,068 | $1,470 | 7.9% | 13 |
| Arkansas | $51,288 | $17,031 | ($1,568) | -8.4% | 37 |
| California | $715,765 | $18,103 | ($496) | -2.7% | 27 |
| Colorado | $98,099 | $16,991 | ($1,608) | -8.6% | 38 |
| Connecticut | $83,832 | $23,248 | $4,650 | 25.0% | 6 |
| Delaware | $19,513 | $19,711 | $1,112 | 6.0% | 15 |
| Florida | $389,699 | $18,093 | ($505) | -2.7% | 28 |
| Georgia | $186,362 | $17,398 | ($1,201) | -6.5% | 34 |
| Hawaii | $34,159 | $23,473 | $4,874 | 26.2% | 4 |
| Idaho | $30,000 | $16,312 | ($2,287) | -12.3% | 46 |
| Illinois | $214,103 | $16,710 | ($1,888) | -10.2% | 42 |
| Indiana | $107,521 | $15,846 | ($2,753) | -14.8% | 49 |
| Iowa | $51,751 | $16,221 | ($2,378) | -12.8% | 47 |
| Kansas | $48,676 | $16,569 | ($2,030) | -10.9% | 43 |
| Kentucky | $88,760 | $19,699 | $1,100 | 5.9% | 16 |
| Louisiana | $87,898 | $18,871 | $273 | 1.5% | 23 |
| Maine | $30,054 | $22,060 | $3,461 | 18.6% | 7 |
| Maryland | $162,341 | $26,281 | $7,682 | 41.3% | 1 |
| Massachusetts | $147,466 | $20,977 | $2,378 | 12.8% | 9 |
| Michigan | $184,437 | $18,302 | ($297) | -1.6% | 26 |
| Minnesota | $93,999 | $16,472 | ($2,126) | -11.4% | 44 |
| Mississippi | $58,630 | $19,799 | $1,200 | 6.5% | 14 |
| Missouri | $114,781 | $18,649 | $50 | 0.3% | 24 |
| Montana | $20,716 | $19,107 | $508 | 2.7% | 20 |
| Nebraska | $32,036 | $16,333 | ($2,266) | -12.2% | 45 |
| Nevada | $55,436 | $17,856 | ($743) | -4.0% | 30 |
| New Hampshire | $25,357 | $18,408 | ($191) | -1.0% | 25 |
| New Jersey | $157,381 | $16,943 | ($1,656) | -8.9% | 41 |
| New Mexico | $49,543 | $23,397 | $4,798 | 25.8% | 5 |
| NEW YORK | $395,716 | $19,589 | $990 | 5.3% | 17 |
| North Carolina | $177,137 | $16,968 | ($1,631) | -8.8% | 40 |
| North Dakota | $14,776 | $18,966 | $367 | 2.0% | 21 |
| Ohio | $200,408 | $16,985 | ($1,614) | -8.7% | 39 |
| Oklahoma | $68,893 | $17,400 | ($1,199) | -6.4% | 33 |
| Oregon | $73,462 | $17,337 | ($1,262) | -6.8% | 35 |
| Pennsylvania | $254,233 | $19,552 | $954 | 5.1% | 18 |
| Rhode Island | $22,254 | $20,279 | $1,681 | 9.0% | 11 |
| South Carolina | $92,106 | $17,995 | ($604) | -3.2% | 29 |
| South Dakota | $16,787 | $18,933 | $334 | 1.8% | 22 |
| Tennessee | $118,460 | $17,141 | ($1,458) | -7.8% | 36 |
| Texas | $509,128 | $17,468 | ($1,130) | -6.1% | 32 |
| Utah | $41,808 | $12,779 | ($5,820) | -31.3% | 50 |
| Vermont | $13,853 | $21,542 | $2,943 | 15.8% | 8 |
| Virginia | $224,765 | $26,040 | $7,442 | 40.0% | 2 |
| Washington | $137,027 | $17,784 | ($815) | -4.4% | 31 |
| West Virginia | $36,391 | $20,288 | $1,689 | 9.1% | 10 |
| Wisconsin | $93,531 | $15,870 | ($2,729) | -14.7% | 48 |
| Wyoming | $11,585 | $20,083 | $1,484 | 8.0% | 12 |
| District of Columbia | $64,657 | $93,768 | $75,169 | 404.2% |
Note: Does not include spending in Puerto Rico and other outlying areas.
Federal Expenditures: Direct Payments, FFY 2020
| Total (millions) | Per Capita | Variation from National Per Capita |
Percentage Variation from National Per Capita |
Rank (per capita) | |
|---|---|---|---|---|---|
| National: 50 States & D.C. | $3,573,757 | $10,782 | |||
| Alabama | $58,197 | $11,583 | $801 | 7.4% | 14 |
| Alaska | $6,895 | $9,402 | ($1,380) | -12.8% | 46 |
| Arizona | $78,448 | $10,969 | $187 | 1.7% | 22 |
| Arkansas | $33,143 | $11,005 | $223 | 2.1% | 20 |
| California | $411,440 | $10,406 | ($376) | -3.5% | 35 |
| Colorado | $53,850 | $9,327 | ($1,455) | -13.5% | 47 |
| Connecticut | $39,501 | $10,955 | $172 | 1.6% | 23 |
| Delaware | $11,951 | $12,072 | $1,290 | 12.0% | 6 |
| Florida | $264,472 | $12,279 | $1,497 | 13.9% | 5 |
| Georgia | $112,247 | $10,479 | ($304) | -2.8% | 34 |
| Hawaii | $17,385 | $11,946 | $1,164 | 10.8% | 9 |
| Idaho | $17,567 | $9,552 | ($1,230) | -11.4% | 45 |
| Illinois | $127,032 | $9,915 | ($868) | -8.0% | 42 |
| Indiana | $67,632 | $9,967 | ($815) | -7.6% | 40 |
| Iowa | $31,676 | $9,929 | ($854) | -7.9% | 41 |
| Kansas | $29,126 | $9,914 | ($868) | -8.1% | 43 |
| Kentucky | $49,741 | $11,039 | $257 | 2.4% | 19 |
| Louisiana | $50,648 | $10,874 | $92 | 0.9% | 27 |
| Maine | $16,865 | $12,379 | $1,597 | 14.8% | 4 |
| Maryland | $70,805 | $11,462 | $680 | 6.3% | 15 |
| Massachusetts | $82,533 | $11,740 | $958 | 8.9% | 11 |
| Michigan | $125,663 | $12,470 | $1,688 | 15.7% | 2 |
| Minnesota | $57,565 | $10,088 | ($695) | -6.4% | 39 |
| Mississippi | $34,591 | $11,681 | $899 | 8.3% | 12 |
| Missouri | $65,686 | $10,672 | ($110) | -1.0% | 31 |
| Montana | $11,870 | $10,948 | $165 | 1.5% | 25 |
| Nebraska | $18,917 | $9,644 | ($1,138) | -10.6% | 44 |
| Nevada | $35,981 | $11,590 | $807 | 7.5% | 13 |
| New Hampshire | $15,651 | $11,362 | $580 | 5.4% | 16 |
| New Jersey | $98,537 | $10,608 | ($174) | -1.6% | 32 |
| New Mexico | $23,192 | $10,952 | $170 | 1.6% | 24 |
| NEW YORK | $228,288 | $11,301 | $518 | 4.8% | 17 |
| North Carolina | $114,729 | $10,990 | $208 | 1.9% | 21 |
| North Dakota | $7,152 | $9,179 | ($1,603) | -14.9% | 48 |
| Ohio | $127,002 | $10,763 | ($19) | -0.2% | 30 |
| Oklahoma | $42,798 | $10,809 | $27 | 0.3% | 29 |
| Oregon | $46,269 | $10,919 | $137 | 1.3% | 26 |
| Pennsylvania | $162,113 | $12,468 | $1,685 | 15.6% | 3 |
| Rhode Island | $13,075 | $11,915 | $1,133 | 10.5% | 10 |
| South Carolina | $61,280 | $11,972 | $1,190 | 11.0% | 8 |
| South Dakota | $9,031 | $10,186 | ($596) | -5.5% | 36 |
| Tennessee | $75,092 | $10,866 | $84 | 0.8% | 28 |
| Texas | $266,064 | $9,129 | ($1,653) | -15.3% | 49 |
| Utah | $23,528 | $7,191 | ($3,591) | -33.3% | 50 |
| Vermont | $7,712 | $11,992 | $1,210 | 11.2% | 7 |
| Virginia | $95,337 | $11,045 | $263 | 2.4% | 18 |
| Washington | $78,254 | $10,156 | ($626) | -5.8% | 37 |
| West Virginia | $22,749 | $12,683 | $1,901 | 17.6% | 1 |
| Wisconsin | $59,679 | $10,126 | ($656) | -6.1% | 38 |
| Wyoming | $6,070 | $10,522 | ($260) | -2.4% | 33 |
| District of Columbia | $8,727 | $12,657 | $1,875 | 17.4% |
Note: Does not include spending for direct payments in Puerto Rico and other outlying areas.
Federal Expenditures: Grants, FFY 2020
| Total (millions) | Per Capita | Variation from National Per Capita |
Percentage Variation from National Per Capita |
Rank (per capita) | |
|---|---|---|---|---|---|
| National: 50 States & D.C. | $806,408 | $2,433 | |||
| Alabama | $9,697 | $1,930 | ($503) | -20.7% | 37 |
| Alaska | $3,671 | $5,005 | $2,572 | 105.7% | 1 |
| Arizona | $17,420 | $2,436 | $3 | 0.1% | 24 |
| Arkansas | $8,908 | $2,958 | $525 | 21.6% | 11 |
| California | $112,064 | $2,834 | $401 | 16.5% | 14 |
| Colorado | $10,643 | $1,843 | ($590) | -24.2% | 44 |
| Connecticut | $9,416 | $2,611 | $178 | 7.3% | 20 |
| Delaware | $2,762 | $2,790 | $357 | 14.7% | 16 |
| Florida | $34,156 | $1,586 | ($847) | -34.8% | 49 |
| Georgia | $17,404 | $1,625 | ($808) | -33.2% | 48 |
| Hawaii | $3,192 | $2,193 | ($240) | -9.8% | 28 |
| Idaho | $3,471 | $1,887 | ($546) | -22.4% | 41 |
| Illinois | $27,086 | $2,114 | ($319) | -13.1% | 32 |
| Indiana | $17,034 | $2,510 | $77 | 3.2% | 23 |
| Iowa | $7,407 | $2,322 | ($111) | -4.6% | 26 |
| Kansas | $5,076 | $1,728 | ($705) | -29.0% | 47 |
| Kentucky | $14,886 | $3,304 | $871 | 35.8% | 7 |
| Louisiana | $17,522 | $3,762 | $1,329 | 54.6% | 4 |
| Maine | $3,889 | $2,854 | $421 | 17.3% | 13 |
| Maryland | $13,418 | $2,172 | ($261) | -10.7% | 30 |
| Massachusetts | $19,160 | $2,726 | $293 | 12.0% | 18 |
| Michigan | $23,942 | $2,376 | ($57) | -2.3% | 25 |
| Minnesota | $14,630 | $2,564 | $131 | 5.4% | 21 |
| Mississippi | $8,364 | $2,824 | $391 | 16.1% | 15 |
| Missouri | $13,735 | $2,232 | ($201) | -8.3% | 27 |
| Montana | $3,211 | $2,962 | $529 | 21.7% | 10 |
| Nebraska | $3,698 | $1,885 | ($548) | -22.5% | 42 |
| Nevada | $5,740 | $1,849 | ($584) | -24.0% | 43 |
| New Hampshire | $2,526 | $1,834 | ($599) | -24.6% | 45 |
| New Jersey | $20,164 | $2,171 | ($262) | -10.8% | 31 |
| New Mexico | $8,456 | $3,994 | $1,561 | 64.1% | 2 |
| NEW YORK | $79,857 | $3,953 | $1,520 | 62.5% | 3 |
| North Carolina | $20,962 | $2,008 | ($425) | -17.5% | 35 |
| North Dakota | $2,041 | $2,619 | $186 | 7.7% | 19 |
| Ohio | $29,864 | $2,531 | $98 | 4.0% | 22 |
| Oklahoma | $7,636 | $1,929 | ($504) | -20.7% | 38 |
| Oregon | $12,804 | $3,022 | $589 | 24.2% | 9 |
| Pennsylvania | $35,541 | $2,733 | $300 | 12.3% | 17 |
| Rhode Island | $3,350 | $3,052 | $619 | 25.5% | 8 |
| South Carolina | $9,730 | $1,901 | ($532) | -21.9% | 40 |
| South Dakota | $1,777 | $2,004 | ($429) | -17.6% | 36 |
| Tennessee | $14,559 | $2,107 | ($326) | -13.4% | 34 |
| Texas | $63,709 | $2,186 | ($247) | -10.2% | 29 |
| Utah | $4,806 | $1,469 | ($964) | -39.6% | 50 |
| Vermont | $2,143 | $3,333 | $900 | 37.0% | 6 |
| Virginia | $15,214 | $1,763 | ($670) | -27.6% | 46 |
| Washington | $16,242 | $2,108 | ($325) | -13.4% | 33 |
| West Virginia | $6,068 | $3,383 | $950 | 39.1% | 5 |
| Wisconsin | $11,227 | $1,905 | ($528) | -21.7% | 39 |
| Wyoming | $1,683 | $2,918 | $485 | 19.9% | 12 |
| District of Columbia | $4,443 | $6,443 | $4,010 | 164.8% |
Note: Does not include spending for grants in Puerto Rico and other outlying areas.
Federal Expenditures: Procurement, FFY 2020
| Total (millions) | Per Capita | Variation from National Per Capita |
Percentage Variation from National Per Capita |
Rank (per capita) | |
|---|---|---|---|---|---|
| National: 50 States & D.C. | $625,904 | $1,888 | |||
| Alabama | $12,986 | $2,585 | $696 | 36.9% | 10 |
| Alaska | $1,985 | $2,707 | $818 | 43.3% | 8 |
| Arizona | $28,028 | $3,919 | $2,031 | 107.5% | 5 |
| Arkansas | $1,543 | $512 | ($1,376) | -72.9% | 49 |
| California | $60,155 | $1,521 | ($367) | -19.4% | 18 |
| Colorado | $11,600 | $2,009 | $121 | 6.4% | 14 |
| Connecticut | $23,165 | $6,424 | $4,536 | 240.2% | 3 |
| Delaware | $767 | $775 | ($1,113) | -58.9% | 41 |
| Florida | $24,772 | $1,150 | ($738) | -39.1% | 24 |
| Georgia | $14,490 | $1,353 | ($536) | -28.4% | 22 |
| Hawaii | $2,848 | $1,957 | $69 | 3.6% | 15 |
| Idaho | $3,122 | $1,697 | ($191) | -10.1% | 16 |
| Illinois | $11,761 | $918 | ($970) | -51.4% | 33 |
| Indiana | $4,568 | $673 | ($1,215) | -64.4% | 46 |
| Iowa | $2,830 | $887 | ($1,001) | -53.0% | 34 |
| Kansas | $3,049 | $1,038 | ($851) | -45.0% | 27 |
| Kentucky | $10,467 | $2,323 | $435 | 23.0% | 11 |
| Louisiana | $3,994 | $858 | ($1,031) | -54.6% | 37 |
| Maine | $2,873 | $2,109 | $220 | 11.7% | 13 |
| Maryland | $43,416 | $7,028 | $5,140 | 272.2% | 2 |
| Massachusetts | $21,159 | $3,010 | $1,121 | 59.4% | 6 |
| Michigan | $7,353 | $730 | ($1,159) | -61.4% | 42 |
| Minnesota | $2,935 | $514 | ($1,374) | -72.8% | 48 |
| Mississippi | $6,835 | $2,308 | $420 | 22.2% | 12 |
| Missouri | $15,936 | $2,589 | $701 | 37.1% | 9 |
| Montana | $718 | $662 | ($1,226) | -64.9% | 47 |
| Nebraska | $1,355 | $691 | ($1,197) | -63.4% | 44 |
| Nevada | $3,027 | $975 | ($913) | -48.4% | 30 |
| New Hampshire | $2,091 | $1,518 | ($370) | -19.6% | 19 |
| New Jersey | $7,660 | $825 | ($1,064) | -56.3% | 38 |
| New Mexico | $10,531 | $4,973 | $3,085 | 163.4% | 4 |
| NEW YORK | $14,058 | $696 | ($1,192) | -63.1% | 43 |
| North Carolina | $9,057 | $868 | ($1,021) | -54.1% | 35 |
| North Dakota | $673 | $864 | ($1,024) | -54.2% | 36 |
| Ohio | $9,416 | $798 | ($1,090) | -57.7% | 40 |
| Oklahoma | $4,400 | $1,111 | ($777) | -41.2% | 26 |
| Oregon | $1,869 | $441 | ($1,447) | -76.6% | 50 |
| Pennsylvania | $18,132 | $1,394 | ($494) | -26.2% | 21 |
| Rhode Island | $1,056 | $962 | ($926) | -49.1% | 31 |
| South Carolina | $6,587 | $1,287 | ($601) | -31.8% | 23 |
| South Dakota | $987 | $1,114 | ($775) | -41.0% | 25 |
| Tennessee | $10,048 | $1,454 | ($434) | -23.0% | 20 |
| Texas | $81,484 | $2,796 | $907 | 48.1% | 7 |
| Utah | $2,631 | $804 | ($1,084) | -57.4% | 39 |
| Vermont | $607 | $943 | ($945) | -50.1% | 32 |
| Virginia | $68,420 | $7,927 | $6,038 | 319.8% | 1 |
| Washington | $12,860 | $1,669 | ($219) | -11.6% | 17 |
| West Virginia | $1,819 | $1,014 | ($874) | -46.3% | 28 |
| Wisconsin | $5,849 | $992 | ($896) | -47.4% | 29 |
| Wyoming | $389 | $675 | ($1,214) | -64.3% | 45 |
| District of Columbia | $27,543 | $39,943 | $38,055 | 2,015.2% |
Note: Does not include spending for procurement in Puerto Rico and other outlying areas.
Federal Expenditures: Wages and Salaries, FFY 2020
| Total (millions) | Per Capita | Variation from National Per Capita |
Percentage Variation from National Per Capita |
Rank (per capita) | |
|---|---|---|---|---|---|
| National: 50 States & D.C. | $287,766 | $868 | |||
| Alabama | $5,011 | $997 | $129 | 14.9% | 15 |
| Alaska | $2,521 | $3,438 | $2,570 | 296.0% | 2 |
| Arizona | $5,231 | $731 | ($137) | -15.7% | 28 |
| Arkansas | $1,584 | $526 | ($342) | -39.4% | 35 |
| California | $27,572 | $697 | ($171) | -19.7% | 30 |
| Colorado | $6,532 | $1,131 | $263 | 30.3% | 11 |
| Connecticut | $1,460 | $405 | ($463) | -53.4% | 43 |
| Delaware | $653 | $659 | ($209) | -24.0% | 32 |
| Florida | $13,662 | $634 | ($234) | -26.9% | 33 |
| Georgia | $11,603 | $1,083 | $215 | 24.8% | 12 |
| Hawaii | $6,011 | $4,130 | $3,262 | 375.7% | 1 |
| Idaho | $1,090 | $593 | ($275) | -31.7% | 34 |
| Illinois | $6,195 | $483 | ($385) | -44.3% | 39 |
| Indiana | $2,581 | $380 | ($488) | -56.2% | 45 |
| Iowa | $1,004 | $315 | ($553) | -63.7% | 48 |
| Kansas | $3,173 | $1,080 | $212 | 24.4% | 13 |
| Kentucky | $4,451 | $988 | $120 | 13.8% | 18 |
| Louisiana | $3,324 | $714 | ($155) | -17.8% | 29 |
| Maine | $1,254 | $921 | $53 | 6.1% | 20 |
| Maryland | $19,213 | $3,110 | $2,242 | 258.2% | 3 |
| Massachusetts | $3,255 | $463 | ($405) | -46.7% | 40 |
| Michigan | $3,088 | $306 | ($562) | -64.7% | 49 |
| Minnesota | $2,084 | $365 | ($503) | -57.9% | 47 |
| Mississippi | $2,632 | $889 | $21 | 2.4% | 22 |
| Missouri | $4,555 | $740 | ($128) | -14.8% | 27 |
| Montana | $1,072 | $988 | $120 | 13.8% | 17 |
| Nebraska | $1,525 | $778 | ($91) | -10.4% | 25 |
| Nevada | $2,151 | $693 | ($175) | -20.2% | 31 |
| New Hampshire | $540 | $392 | ($476) | -54.8% | 44 |
| New Jersey | $3,438 | $370 | ($498) | -57.4% | 46 |
| New Mexico | $2,922 | $1,380 | $512 | 59.0% | 6 |
| NEW YORK | $8,312 | $411 | ($457) | -52.6% | 42 |
| North Carolina | $11,914 | $1,141 | $273 | 31.5% | 10 |
| North Dakota | $1,085 | $1,393 | $525 | 60.4% | 5 |
| Ohio | $5,739 | $486 | ($382) | -44.0% | 37 |
| Oklahoma | $4,637 | $1,171 | $303 | 34.9% | 9 |
| Oregon | $1,908 | $450 | ($418) | -48.1% | 41 |
| Pennsylvania | $6,324 | $486 | ($382) | -44.0% | 38 |
| Rhode Island | $1,093 | $996 | $128 | 14.7% | 16 |
| South Carolina | $4,686 | $916 | $47 | 5.4% | 21 |
| South Dakota | $933 | $1,052 | $184 | 21.2% | 14 |
| Tennessee | $3,564 | $516 | ($353) | -40.6% | 36 |
| Texas | $22,376 | $768 | ($100) | -11.6% | 26 |
| Utah | $2,777 | $849 | ($19) | -2.2% | 23 |
| Vermont | $529 | $823 | ($45) | -5.2% | 24 |
| Virginia | $26,190 | $3,034 | $2,166 | 249.5% | 4 |
| Washington | $9,563 | $1,241 | $373 | 43.0% | 7 |
| West Virginia | $1,753 | $978 | $109 | 12.6% | 19 |
| Wisconsin | $1,721 | $292 | ($576) | -66.4% | 50 |
| Wyoming | $702 | $1,216 | $348 | 40.1% | 8 |
| District of Columbia | $20,571 | $29,833 | $28,965 | 3,336.1% |
Note: Does not include spending for wages and salaries in Puerto Rico and other outlying areas.
Federal Expenditures: Other Identified Federal Spending, FFY 2020
| Total (millions) | Per Capita | Variation from National Per Capita |
Percentage Variation from National Per Capita |
Rank (per capita) | |
|---|---|---|---|---|---|
| National: 50 States & D.C. | $870,699 | $2,627 | |||
| Alabama | $10,322 | $2,055 | ($572) | -21.8% | 45 |
| Alaska | $3,148 | $4,292 | $1,665 | 63.4% | 5 |
| Arizona | $14,391 | $2,012 | ($615) | -23.4% | 48 |
| Arkansas | $6,111 | $2,029 | ($598) | -22.8% | 47 |
| California | $104,533 | $2,644 | $17 | 0.6% | 25 |
| Colorado | $15,474 | $2,680 | $53 | 2.0% | 23 |
| Connecticut | $10,289 | $2,853 | $226 | 8.6% | 19 |
| Delaware | $3,380 | $3,414 | $787 | 30.0% | 8 |
| Florida | $52,637 | $2,444 | ($183) | -7.0% | 34 |
| Georgia | $30,618 | $2,858 | $231 | 8.8% | 18 |
| Hawaii | $4,724 | $3,246 | $619 | 23.6% | 13 |
| Idaho | $4,749 | $2,582 | ($44) | -1.7% | 28 |
| Illinois | $42,030 | $3,280 | $653 | 24.9% | 12 |
| Indiana | $15,705 | $2,315 | ($312) | -11.9% | 39 |
| Iowa | $8,833 | $2,769 | $142 | 5.4% | 21 |
| Kansas | $8,253 | $2,809 | $182 | 6.9% | 20 |
| Kentucky | $9,214 | $2,045 | ($582) | -22.2% | 46 |
| Louisiana | $12,410 | $2,664 | $37 | 1.4% | 24 |
| Maine | $5,173 | $3,797 | $1,170 | 44.5% | 6 |
| Maryland | $15,489 | $2,507 | ($119) | -4.5% | 30 |
| Massachusetts | $21,359 | $3,038 | $411 | 15.7% | 15 |
| Michigan | $24,390 | $2,420 | ($207) | -7.9% | 35 |
| Minnesota | $16,785 | $2,941 | $315 | 12.0% | 17 |
| Mississippi | $6,208 | $2,096 | ($531) | -20.2% | 44 |
| Missouri | $14,868 | $2,416 | ($211) | -8.0% | 36 |
| Montana | $3,846 | $3,547 | $920 | 35.0% | 7 |
| Nebraska | $6,541 | $3,335 | $708 | 26.9% | 10 |
| Nevada | $8,537 | $2,750 | $123 | 4.7% | 22 |
| New Hampshire | $4,548 | $3,301 | $674 | 25.7% | 11 |
| New Jersey | $27,581 | $2,969 | $342 | 13.0% | 16 |
| New Mexico | $4,442 | $2,098 | ($529) | -20.1% | 43 |
| NEW YORK | $65,200 | $3,228 | $601 | 22.9% | 14 |
| North Carolina | $20,474 | $1,961 | ($666) | -25.3% | 49 |
| North Dakota | $3,825 | $4,910 | $2,283 | 86.9% | 1 |
| Ohio | $28,387 | $2,406 | ($221) | -8.4% | 37 |
| Oklahoma | $9,422 | $2,380 | ($247) | -9.4% | 38 |
| Oregon | $10,611 | $2,504 | ($123) | -4.7% | 31 |
| Pennsylvania | $32,123 | $2,471 | ($156) | -6.0% | 32 |
| Rhode Island | $3,681 | $3,354 | $727 | 27.7% | 9 |
| South Carolina | $9,823 | $1,919 | ($708) | -26.9% | 50 |
| South Dakota | $4,058 | $4,577 | $1,950 | 74.2% | 3 |
| Tennessee | $15,198 | $2,199 | ($428) | -16.3% | 42 |
| Texas | $75,495 | $2,590 | ($37) | -1.4% | 27 |
| Utah | $8,066 | $2,466 | ($161) | -6.1% | 33 |
| Vermont | $2,862 | $4,451 | $1,824 | 69.4% | 4 |
| Virginia | $19,605 | $2,271 | ($356) | -13.5% | 40 |
| Washington | $20,108 | $2,610 | ($17) | -0.7% | 26 |
| West Virginia | $4,001 | $2,230 | ($397) | -15.1% | 41 |
| Wisconsin | $15,053 | $2,554 | ($73) | -2.8% | 29 |
| Wyoming | $2,741 | $4,752 | $2,125 | 80.9% | 2 |
| District of Columbia | $3,374 | $4,893 | $2,266 | 86.2% |
Note: Does not include other identified federal spending in Puerto Rico and other outlying areas.
Appendix B: Methodology
The starting point for this analysis is the federal budget and its figures on total receipts and outlays in Federal Fiscal Year 2020. Excluded are receipts and outlays for which allocations cannot be made based on readily identifiable data, or for which allocation by state is not relevant. Such receipts include the deposit of earnings from the Federal Reserve and customs duties. Spending which has not been allocated by state is primarily interest paid on the federal debt, spending for international procurement and other overseas activity, offsets from undistributed receipts and unidentified outlays.
This analysis is confined to federal spending in and revenues from the 50 states and the District of Columbia. Because per capita figures for the District of Columbia are disproportionately large in many cases, such amounts are excluded from state rankings. The analysis does not include receipts from and expenditures in Puerto Rico, the U.S. Virgin Islands, Guam, American Samoa and other outlying areas. About 94 percent of federal receipts and expenditures are allocated by state in this report.
Revenues
Data from the Internal Revenue Service (IRS) and other federal agencies on taxes and fees were used as the basis for the estimates of revenues generated by each state. Sources that were used to supplement IRS data include: the U.S. Social Security Administration, for allocation of Federal Insurance Contributions Act and Self Employed Contributions Act payroll taxes; the U.S. Bureau of Economic Analysis (BEA), for data used to allocate corporate taxes based on the location of business activity; the U.S. Department of Transportation, the Federation of Tax Administrators, and the National Institute of Alcoholism and Alcohol Abuse, for allocation of excise taxes; and the U.S. Bureau of Labor Statistics, for allocation of federal employee retirement contributions.
Expenditures
Federal budget outlays in FFY 2020 were grouped into five broad categories: direct payments to or for individuals (for example, Social Security and Medicare); grants (for example, Medicaid and highway grants); procurement; wages and salaries; and spending not categorized as direct payments or grants by the federal budget, referred to in this report as “Other Identified Federal Spending” (see section by this name). Such groupings were developed using the federal budget and other federal government information on federal expenditures. Spending in these five categories and their major subcategories was then allocated by state using various sources. These included USAspending.gov, the federal government’s source for federal spending information; SAM.gov, a federal government website (System for Award Management) and portal which provides federal procurement data; BEA; Census Bureau, Federal Reserve Board, Federal Emergency Management Administration; IRS; the federal Office of Management and Budget and the Office of Personnel Management; the federal departments of Agriculture, Defense, Education, Health and Human Services, Labor, Transportation, Treasury, and Veterans Affairs; the Railroad Retirement Board; Small Business Administration and the Social Security Administration. The Federal Funds Information for States (FFIS) master grant data base was also used as a source for determining allocations to states for certain federal grant programs.
Federal Government Receipts and Outlays, FFY 2020 - Amounts Allocated and Not Allocated in This Report (figures in millions)
| Allocated | ||||
|---|---|---|---|---|
| Total | Not Allocable | Outside the 50 States and D.C. | 50 States and D.C. | |
| Receipts | $3,421,162 | $186,297 | $25,654 | $3,209,211 |
| Outlays | $6,550,396 | $331,120 | $54,741 | $6,164,535 |
| Deficit | ($3,129,234) | |||
Appendix C
United States Government
Department of Agriculture
Coronavirus Food Assistance Program 1 Data at https://www.farmers.gov/coronavirus/pandemic-assistance/cfap1/data.
Food and Nutrition Service:
SNAP (Supplemental Nutrition Assistance Program) Data Tables, National and/or State Level Monthly and/or Annual Data: FY69 through FY22 at https://www.fns.usda.gov/pd/supplemental-nutrition-assistance-program-snap.
Department of Commerce
Bureau of Economic Analysis:
Regional Data, GDP & Personal Income, Annual and Quarterly Gross Domestic Product (GDP) by State available at https://apps.bea.gov/itable/iTable.cfm?ReqID=70&step=1#reqid=70&step=1&isuri=1. See also Interactive Data/Interactive Data: GDP by State at https://www.bea.gov/data/gdp/gdp-state.
Regional Data, GDP & Personal Income, Quarterly Personal Income by State. See Quarterly Personal Income by State/Personal Current Transfer Receipts (SQINC35) (Medicare benefits); and Quarterly Personal Income by State/Wages and Salaries by Industry (SQINC7) (NAICS) at https://apps.bea.gov/iTable/iTable.cfm?reqid=99&step=1#reqid=99&step=1 and https://apps.bea.gov/iTable/iTable.cfm?reqid=70&step=1&acrdn=2.
State Personal Income and Employment: Concepts, Data Sources, and Statistical Methods, September 2021 at https://www.bea.gov/system/files/methodologies/SPI-Methodology.pdf.
Census Bureau:
Table 2. Resident Population for the 50 States, the District of Columbia, and Puerto Rico: 2020 Census, last revised October 8, 2021 at https://www.census.gov/data/tables/2020/dec/2020-apportionment-data.html (in prior years, OSC has used the NST-EST Vintage population estimates series).
2020 American Community Survey 1-Year Estimates, B14001: School Enrollment by Level of School for the Population 3 Years and Over at https://data.census.gov/cedsci/table?q=B14001%20enrollment&g=0100000US%240400000&tid=ACSDT1Y2019.B14001.
Department of Defense
Office of the Actuary, Statistical Report on the Military Retirement System, Fiscal Year Ended September 2020; Number of Military Retirees by State as of September 30, 2020 (page 23) and Number of Military Retirees by Country as of September 30, 2020 (pages 26-28), August 2020 at https://media.defense.gov/2021/Sep/29/2002864217/-1/-1/0/MRS_STATRPT_2020%20[SEPT.%202021].PDF.
Defense Health Agency/Military Health System (Health.mil), Patient Numbers By State at https://health.mil/I-Am-A/Media/Media-Center/Patient-Population-Statistics/Patient-Numbers-By-State.
Department of Health and Human Services
Centers for Medicare and Medicaid Services:
Effectuated Enrollment: Early 2021 Snapshot and Full Year 2020 Average, June 5, 2021 at https://www.cms.gov/document/Early-2021-2020-Effectuated-Enrollment-Report.pdf (for premium tax credit data).
Expenditure Reports from MBES/CBES (Medicaid Budget and Expenditure System/State Children’s Health Insurance Program Budget and Expenditure System), Financial Management Report for FY 2020 at https://www.medicaid.gov/medicaid/finance/state-expenditure-reporting/expenditure-reports/index.html.
Medicaid CMS-64 FFCRA Increased FMAP Expenditure Data (see three quarterly reports for FFY 2020: January 1, 2020 – September 30, 2020) at https://www.medicaid.gov/medicaid/financial-management/state-budget-expenditure-reporting-for-medicaid-and-chip/expenditure-reports-mbescbes/medicaid-cms-64-ffcra-increased-fmap-expenditure-data-collected-through-mbes/index.html.
Health Resources & Services Administration:
Provider Relief Fund General Distributions, January 2022 (last reviewed) at https://www.hrsa.gov/provider-relief/data/general-distribution; Provider Relief Fund Past Payments, December 2021 (last reviewed) at https://www.hrsa.gov/provider-relief/past-payments; and Provider Relief Fund Targeted Distributions, November 2021 (last reviewed) at https://www.hrsa.gov/provider-relief/data/targeted-distribution.
Department of Labor
Bureau of Labor Statistics, Quarterly Census of Employment and Wages for Ownership: Federal Government and Industry: NAICS 491 Postal Service at https://data.bls.gov/cew/apps/data_views/data_views.htm#tab=Tables.
Employment Training Administration, ETA 2112: UI Financial Transaction Summary at https://oui.doleta.gov/unemploy/DataDownloads.asp.
Office of Unemployment Insurance, Families First Coronavirus Response Act and Coronavirus Aid, Relief, and Economic Security (CARES) Act Funding to States through October 3, 2020 at https://oui.doleta.gov/unemploy/docs/cares_act_funding_state.html.
Department of Transportation
Federal Aviation Administration, Passenger Boarding (Enplanement) and All-Cargo Data for U.S. Airports – Previous Calendar Year Data, CY 2020 at https://www.faa.gov/airports/planning_capacity/passenger_allcargo_stats/passenger/.
Federal Highway Administration, Highway Statistics 2019, Federal Highway Trust Fund Receipts Attributable to Highway Users in Each State, Table FE-9 at https://www.fhwa.dot.gov/policyinformation/statistics/2019/fe9.cfm; and Status of the Federal Highway Trust Fund, October 1, 2019 – September 30, 2020, Table FE-10 at https://www.fhwa.dot.gov/policyinformation/statistics/2020/fe10.cfm (last modified on November 8, 2021). See also https://www.fhwa.dot.gov/policyinformation/statistics/2020/.
Federal Transit Administration, Fiscal Year 2020 CARES Act Apportionments/Allocations by State for Selected FTA Programs, Updated August 27, 2021 at https://www.transit.dot.gov/funding/apportionments/cares-act-formula-apportionments-state.
Department of the Treasury
Coronavirus Relief Fund, Payments to States and Eligible Units of Local Government, May 11, 2020 at https://home.treasury.gov/system/files/136/Payments-to-States-and-Units-of-Local-Government.pdf.
Report on Pandemic Relief for Aviation Workers: Pursuant to Section 4118 of the Coronavirus Aid, Relief and Economic Security Act, November 1, 2020 at https://home.treasury.gov/system/files/136/Sec4118ReporttoCongressPayrollSupportNovember2020.pdf.
Internal Revenue Service
IRS Statement on Economic Impact Payments by state (as of Aug. 28, 2020) at https://www.irs.gov/newsroom/irs-statement-on-economic-impact-payments-by-state-as-of-aug-28-2020.
Statistics of Income (SOI) Tax Stats – Historic Table 2, Individual Income and Tax Data, by State and Size of Adjusted Gross Income, Tax Year 2019 at http://www.irs.gov/statistics/soi-tax-stats-historic-table-2.
Statistics of Income (SOI) Tax Stats – IRS Data Book, Table 5: Gross Collections, by Type of Tax and State, Fiscal Year 2020 and Table 8: Amount of Refunds Issued, Including Interest, by Type of Refund and State, Fiscal Year 2020 at https://www.irs.gov/statistics/soi-tax-stats-gross-collections-by-type-of-tax-and-state-irs-data-book-table-5 (2020 Data Book, October 1, 2019 to September 30, 2020). See also https://www.irs.gov/pub/irs-pdf/p55b.pdf.
Executive Office of the President, Office of Management and Budget: President’s Budget
Analytical Perspectives, Supplemental Materials as Spreadsheets, Tables 11-3 through 11-49. 2022 Budget Program State-by-State Tables at https://www.whitehouse.gov/omb/analytical-perspectives/.
Budget Appendix, see https://www.whitehouse.gov/omb/appendix/.
Historical Tables, see: Table 1.1 – Summary of Receipts, Outlays, and Surpluses or Deficits (-): 1789 – 2026; Table 2.1 – Receipts by Source: 1934 – 2026; Table 2.4 – Composition of Social Insurance and Retirement Receipts and of Excise Taxes: 1940 – 2026; Table 2.5 – Composition of “Other Receipts”: 1940 – 2026; Table 3.2 – Outlays by Function and Subfunction: 1962 – 2026; Table 5.1 – Budget Authority by Function and Subfunction: 1976 – 2026; Table 6.1 – Composition of Outlays: 1940 – 2026; and Table 11.3 – Outlays for Payments for Individuals by Category and Major Program: 1940 – 2026 at https://www.whitehouse.gov/omb/historical-tables/.
Supplemental Materials, Public Budget Database, Outlays XLSX at https://www.whitehouse.gov/omb/supplemental-materials/.
Supplemental Materials, Supporting Documents, Object Class Analysis, Fiscal Year 2022 at https://www.whitehouse.gov/wp-content/uploads/2021/05/objclass_fy22.pdf.
Small Business Administration
Disaster Assistance Update, EIDL Advance, July 15, 2020 at https://www.sba.gov/sites/default/files/2021-02/EIDL%20COVID-19%20Advance%207.15.20-508.pdf; see also https://www.sba.gov/document/report-covid-19-eidl-advance-reports-2020.
Disaster Assistance Update, Nationwide EIDL Loans, September 14, 2020 at https://www.sba.gov/sites/default/files/2021-02/EIDL%20COVID-19%20Loan%209.14.20_0.pdf; see also https://www.sba.gov/document/report-covid-19-eidl-reports-2020.
Paycheck Protection Program (PPP) Report: Approvals through 08/08/2020, States and Territories (page 5) at https://home.treasury.gov/system/files/136/SBA-Paycheck-Protection-Program-Loan-Report-Round2.pdf.
Social Security Administration
Annual Statistical Supplement, 2021 – Old-Age, Survivors, and Disability Insurance: Benefits in Current-Payment Status, Geographic Data (5J); and Supplemental Security Income: State Data (7.B) at https://www.ssa.gov/policy/docs/statcomps/supplement/.
Earnings and Employment Data for Workers Covered Under Social Security and Medicare, by State and County, 2018 at https://www.ssa.gov/policy/docs/statcomps/eedata_sc/2018/.
Other
Department of Education, Federal Student Loan Portfolio, Direct Loan Portfolio by Location at https://studentaid.gov/data-center/student/portfolio.
Department of Veterans Affairs, National Center for Veterans Analysis and Statistics, Geographic Distribution of VA Expenditures for Fiscal Year 2020, FY20 Summary of Expenditures by State, June 2021 at https://www.va.gov/vetdata/expenditures.asp.
Federal Emergency Management Administration, OpenFEMA Dataset: Public Assistance Funded Projects Details - v1 download for federal fiscal year 2020 at https://www.fema.gov/openfema-data-page/public-assistance-funded-projects-details-v1.
Federal Reserve Board, Main Street Lending Program Facility Transaction-specific Disclosures (XLSX) at https://www.federalreserve.gov/publications/2021-reports-to-congress-in-response-to-covid-19.htm; and Periodic Report: Update on Outstanding Lending Facilities Authorized by the Board under Section 13(3) of the Federal Reserve Act, January 10, 2022 at https://www.federalreserve.gov/monetarypolicy/mainstreetlending.htm.
National Institute of Alcoholism and Alcohol Abuse, Surveillance Report #117, Table 2. Apparent alcohol consumption for States, census regions, and the United States, 2019 at https://pubs.niaaa.nih.gov/publications/surveillance117/tab2_19.htm.
Office of Personnel Management (OPM), Civil Service Retirement and Disability Program, Exhibit R14: Fiscal Year 2020 Annuitants on The Retirement Roll – CSRS/FERS Employees and Survivor Annuitants: Geographic Distribution by Number on Roll and Monthly Annuities, provided on October 27, 2021.
Railroad Retirement Board, Annual Railroad Retirement Act and Railroad Unemployment Insurance Act Data, Statistical Tables, Section A – Financial Statistics, Table A6.– Retirement, survivor, unemployment, and sickness benefit payments, by class of benefit and state of residence of beneficiary, fiscal year 2020 (In thousands), cash basis at https://www.rrb.gov/sites/default/files/2021-09/ST20parta.pdf.
SAM.gov, Contract Data (FPDS) Reports, Federal Contract Actions and Dollars (FY 2020), Geographical Report by Place of Performance, FY 2020 and Ad Hoc Report by Agency and State, FY 2020 at https://sam.gov/content/home (site for accessing data from Federal Procurement Data System, see https://www.fpds.gov/fpdsng_cms/index.php/en/).
USAspending.gov, see Award Search/Advanced Search and Download/Award Data Archive at https://www.usaspending.gov/.
Non-U.S. Government
Federal Funds Information for States, FFIS Grants Database at https://ffis.org/database.
Office of the New York State Comptroller, Bureau of State Accounting Operations, Essential Plan Trust Fund Receipts, Fiscal Years 2019 and 2020, generated on January 14, 2022 (sources: Statewide Financial System and New York State Department of Health/Federal Category of Aid).
Orzechowski and Walker, The Tax Burden on Tobacco, Volume 51, 1970-2019, Table 11, State Tax-Paid Cigarette Sales at https://chronicdata.cdc.gov/Policy/The-Tax-Burden-on-Tobacco-1970-2019/7nwe-3aj9.