

Arts, Entertainment and Recreation in New York City
Recent Trends and Impact of COVID-19
February 2021
Watch a discussion of the challenges facing the industry
with State Comptroller DiNapoli and industry leaders.
Highlights
- In 2019, New York City’s arts, entertainment and recreation sector employed 93,500 people in 6,250 establishments. These jobs had an average salary of $79,300 and generated $7.4 billion in total wages.
- In 2019, 128,400 residents (including nearly 31,000 self-employed residents) drew their primary source of earnings from the arts, entertainment and recreation sector.
- From 2009 to 2019, employment in the sector grew by 42 percent, faster than the 30 percent rate for total private sector employment. Establishments and total wages in the sector also grew faster than all establishments and wages citywide.
- As of December 2020, arts, entertainment and recreation employment declined by 66 percent from one year earlier, the largest decline among the City’s economic sectors.
- The Chelsea/Clinton/Midtown Manhattan Business District neighborhood, home to 1,921 venues, accounted for 46 percent of all jobs in the sector, far more than any other City neighborhood.
- The sector benefited from the federal Pandemic Unemployment Assistance program intended for independent contractors and self-employed workers.
- Federal Paycheck Protection Program loans supported 62 percent of firms and 70 percent of employment in the sector.
- A new federal relief package provides $15 billion nationally for shuttered live venues and $284 billion in funds for more Paycheck Protection Program loans through March.
New York City has a world-renowned arts, entertainment and recreation sector, featuring celebrated performance venues, museums and sports teams as well as innovative artists and centers of creativity. The City’s identity as a cultural powerhouse that provides unparalleled offerings and fosters new and established artists is a magnet for individuals and businesses to locate here, making the sector vital to the City’s economy.
The activities offered by this sector also draw many tourists to New York City. NYC & Company (the City’s convention and visitors bureau) estimated that nearly 67 million tourists visited the City in 2019 and accounted for $70 billion in economic activity. In 2020, however, they expect the number of tourists declined to 23 million. Until the sector is able to fully reopen, tourism will remain subdued.
Prior to the COVID-19 pandemic, the level of employment, the number of establishments and total wages in the arts, entertainment and recreation sector had each expanded significantly over the past decade, growing at a much faster rate than for all sectors citywide.
In March 2020, the response to the public health crisis forced the entire sector to close. While some venues, such as outdoor botanical gardens, zoos, museums and gyms, have reopened at reduced capacity, many establishments remain closed because of the health risks associated with attendance at live events. Arts, entertainment and recreation has been the most impacted sector in the City, with the slowest improvement in employment. A new federal aid package provides some badly needed relief for closed live venues as well as additional funds for small businesses. New York State and City have also recently undertaken new initiatives to help restart the arts and entertainment sector.
Arts, Entertainment and Recreation Sector Profile1
The Sector in 2019
Before the pandemic, arts, entertainment and recreation in New York City accounted for 93,500 private sector jobs at 6,250 establishments in 2019.2 These jobs had an average salary of $79,300 and provided $7.4 billion in total wages. The sector represented 2.4 percent of private sector jobs and 2.3 percent of firms, higher than their shares nationally (1.9 percent and 1.6 percent, respectively).
In addition to the 6,250 establishments that have employees, the sector includes many additional freelance artists, musicians, agents and other single-person businesses. In 2018 (the latest year for which data are available), the sector included 88,800 single-person businesses (including individuals who were self-employed, independent contractors or sole-proprietors). For some individuals, these businesses provided a main source of income; for many others, they supplemented income obtained from other employment.
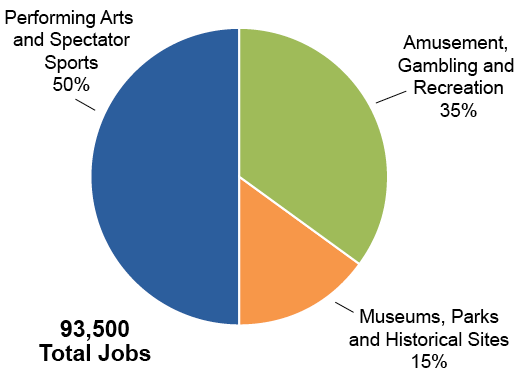
The arts, entertainment and recreation sector includes three subsectors, the largest of which is performing arts and spectator sports. This subsector accounted for half of the 93,500 jobs in this sector overall (see Figure 1). Performing arts and spectator sports, which includes actors as well as professional athletes, is also the highest-paying subsector, with an average salary of $114,600 in 2019.
FIGURE 1 - Arts, Entertainment and Recreation Employment by Subsector
Sources: NYS Department of Labor; OSC analysis
Performing arts and spectator sports covers a broad range of attractions, from theater, dance and opera companies to musical groups and sports teams. The subsector includes such iconic establishments as the Metropolitan Opera, Broadway and off-Broadway theaters, Carnegie Hall, the Apollo Theater, the Brooklyn Academy of Music, and New York City’s professional sports teams, as well as many smaller establishments and performance venues.
The second-largest subsector, which had 32,700 jobs (35 percent of the total) with an average salary of $36,600, consists of amusement, gambling and recreation businesses, such as fitness centers, amusement parks, bowling alleys and casinos.
Museums, parks and historical sites is the third subsector, accounting for 14,300 jobs (15 percent of the total) with an average salary of $61,800. World-renowned establishments such as the Metropolitan Museum of Art, the Museum of Modern Art, the American Museum of Natural History and the Bronx Zoo are in this sector, along with other museums and related establishments throughout the five boroughs.
Among the 6,250 establishments in the sector that have employees (i.e., excluding single-person businesses), nearly 90 percent had fewer than 20 employees in 2019. More than three-quarters of these small businesses were in the performing arts and spectator sports subsector. Still, the sector overall included 26 large establishments that had 500 or more employees, 14 of which were in performing arts and spectator sports.
Manhattan enjoys a predominant share of activity in the sector overall, with 76 percent of the jobs and 70 percent of the establishments (see Figure 2). Jobs in Manhattan also paid the highest average salary among the boroughs, at $81,920.
FIGURE 2 - Share of Employment & Firms by Borough in Arts, Entertainment and Recreation
| Borough | Jobs | Firms | Average Salaries | Share of Jobs |
| Manhattan | 70,950 | 4,400 | $81,920 | 76% |
| Brooklyn | 10,160 | 1,080 | 64,840 | 11% |
| Queens | 7,100 | 520 | 61,870 | 8% |
| Bronx | 3,800 | 130 | 33,540 | 4% |
| Staten Island | 1,500 | 140 | 29,590 | 2% |
| NYC | $93,500 | $6,250 | $79,290 | 100% |
Note: Columns may not add to totals due to rounding.
Sources: NYS Department of Labor; OSC analysis
The Chelsea / Clinton / Midtown Manhattan Business District neighborhood, which contains both the Theater District and a recreation complex at Chelsea Piers, had the largest concentration of jobs and establishments in this sector among all the City’s 55 Census-defined neighborhoods. The neighborhood accounted for nearly half (46 percent) of all arts and recreation jobs citywide (see Figure 3).3 The Upper West Side / West Side, which includes Lincoln Center and the American Museum of Natural History, had the second-largest employment, accounting for one out of 10 jobs citywide.
Three-fourths of all employment and nearly two-thirds of all employers in the sector were located in just six neighborhoods (ranked by employment), all but one of which were in Manhattan. Together, the next nine neighborhoods among the top 15 in terms of jobs accounted for another 13 percent of the sector’s employment. Establishments and jobs were located across the City (although on a much smaller scale) in the rest of the City’s 55 neighborhoods.
FIGURE 3 - The 15 Neighborhoods with the Most Arts, Entertainment and Recreation Employment, 2019
| Borough | Number of Jobs | Share of Sector Jobs | Cumulative Share |
| Chelsea / Clinton / Midtown Business District | 42,609 | 46% | 46% |
| Upper West Side / West Side | 9,369 | 10% | 56% |
| Battery Park City / Greenwich Village / Soho | 7,481 | 8% | 64% |
| Upper East Side | 4,100 | 4% | 68% |
| Murray Hill / Gramercy / Stuyvesant Town | 3,573 | 4% | 72% |
| Park Slope / Carroll Gardens / Red Hook | 2,584 | 3% | 75% |
| Brooklyn Heights / Fort Greene | 2,192 | 2% | 77% |
| Belmont, Crotona Park East / East Tremont | 1,816 | 2% | 79% |
| Howard Beach / Ozone Park | 1,787 | 2% | 81% |
| Chinatown / Lower East Side | 1,634 | 2% | 83% |
| Greenpoint / Williamsburg | 1,401 | 1% | 84% |
| Elmhurst / South Corona | 1,199 | 1% | 85% |
| Concourse / Highbridge / Mt. Eden | 879 | 1% | 86% |
| Brighton Beach / Coney Island | 678 | 1% | 87% |
| Astoria / Long Island City | 669 | 1% | 88% |
| Subtotal | 81,971 | 88% | 88% |
| NYC | 93,500 | 100% | 100% |
Sources: NYS Department of Labor; OSC analysis
From 2009 to 2019, employment in the arts and recreation sector grew by 42 percent, much faster than total private sector employment (30 percent). The number of establishments increased by 28 percent, also much faster than citywide (19 percent), with growth rates surging in Brooklyn (108 percent), Staten Island (41 percent) and Queens (37 percent). Total wages in this sector rose by 78 percent citywide compared to 64 percent for all sectors.
While growth was spread across many areas of the arts, entertainment and recreation sector, the largest drivers were fitness and recreation centers (which accounted for nearly one-third of the job growth) and promoters of performing arts and sports events (which accounted for one-quarter of the job growth), followed by museums and theater companies.
Arts, Entertainment and Recreation Workforce
Characteristics of the Workforce
In 2019, 128,400 residents (including nearly 31,000 self-employed residents) drew their primary earnings from working in the arts, entertainment and recreation sector (either part-time or full-time), with average annual earnings of $63,100.4 These residents worked as artists, actors, musicians, fitness instructors and producers, as well as office workers, computer specialists, graphic designers and building staff; most of these occupations cannot be done remotely (see Figure 4 for the top occupations in this sector).
FIGURE 4 - Top 15 Occupations in Arts, Entertainment and Recreation, 2019
| Occupation | Number of Workers | Share of Sector | Average Earnings |
| Exercise Trainers & Fitness Instructors | 8,848 | 6.9% | $61,794 |
| Other Managers, e.g., Theater or Personal Services Managers | 7,492 | 5.8% | $98,335 |
| Musicians & Singers | 7,026 | 5.5% | $43,966 |
| Actors | 6,682 | 5.2% | $65,756 |
| Other Entertainment Attendants & Workers | 5,574 | 4.3% | $18,897 |
| Janitors & Building Cleaners | 5,255 | 4.1% | $29,437 |
| Writers & Authors | 4,883 | 3.8% | $102,909 |
| Artists & Related Workers | 4,742 | 3.7% | $85,624 |
| Agents & Business Managers | 4,608 | 3.6% | $127,797 |
| Archivists, Curators, & Museum Technicians | 3,063 | 2.4% | $58,513 |
| Security Guards & Gaming Officers | 2,944 | 2.3% | $48,326 |
| Landscapers & Groundskeepers | 2,686 | 2.1% | $28,834 |
| All Other Entertainers & Sports Workers, e.g., Comedians & Magicians | 2,548 | 2.0% | $67,460 |
| Other Teachers, e.g., Acting Instructors | 2,473 | 1.9% | $27,046 |
| Producers & Directors | 2,441 | 1.9% | $62,849 |
| Subtotal | 71,265 | 55.5% | $64,272 |
| Total Sector | 124,400 | 100% | $63,100 |
Sources: U.S. Census Bureau, American Community Survey, 2019 1-year estimates; OSC analysis
Where the Workforce Lives
While the largest share (nearly 40 percent) of the arts and recreation workforce lived in Manhattan in 2019, more than one-fourth lived in Brooklyn and another one-fifth lived in Queens (see Figure 5).
FIGURE 5 - Share of All Residents Working in Arts, Entertainment and Recreation by Borough
| Borough | Number of Workers | Share of Sector Workers |
| Manhattan | 49,600 | 39% |
| Brooklyn | 35,700 | 28% |
| Queens | 24,900 | 19% |
| Bronx | 14,900 | 12% |
| Staten Island | 3,200 | 3% |
| NYC | 128,400 | 100% |
Note: Columns may not add to totals due to rounding.
Sources: U.S. Census Bureau, American Community Survey, 2019 1-year estimates; OSC analysis
City residents working in arts, entertainment and recreation lived everywhere in the City and were spread out among all of the City’s 55 Census-defined neighborhoods. All but nine neighborhoods had at least 1,000 residents working in this sector, and none had more than 6.3 percent of all the workers in this sector citywide (see Appendix A).
Among the top 15 neighborhoods with the most residents working in the sector, the number of workers ranged from 8,000 in the Upper West Side/West Side (and nearly 8,000 in Hamilton Heights/Manhattanville/West Harlem) to 3,248 residents in Central Harlem. In the top 15 neighborhoods, the share of the total workforce citywide ranged from 6.3 percent to 2.5 percent. Out of those neighborhoods, eight were in Manhattan, five were in Brooklyn and two were in Queens.
These data suggest that the pandemic-related closure of many organizations in this sector (along with others being reduced to very limited operations) has impacted not only this sector’s workforce, but also the neighborhoods where workers live all across the City.
Workforce Demographics
Immigrants made up less than one-quarter (23 percent) of the resident workforce in this sector, a lower share than among all occupations citywide (44 percent). More men (53 percent) than women (47 percent) worked in this sector, while the City’s entire workforce was evenly divided between men and women.
Including both immigrants and native-born residents, Whites made up the largest share of residents working in the arts and recreation sector (56 percent), a higher share than among all resident workers (see Figure 6). Hispanics or Latinos, Blacks or African Americans and Asians all represented lower shares of the residents working in this sector than among all working residents citywide.
FIGURE 6 - Share of Workers in Arts, Entertainment and Recreation Sector by Race and Ethnicity
| Race / Ethnicity | Sector Workers | All NYC Workers |
| White | 56% | 35% |
| Hispanic or Latino | 17% | 27% |
| Black or African American | 16% | 20% |
| Asian | 8% | 15% |
| Other | 3% | 3% |
| Total | 100% | 100% |
Sources: U.S. Census Bureau, American Community Survey, 2019 1-year estimates; OSC analysis
COVID-19 Impact: Then and Now
Nearly 87,000 people were employed in the arts, entertainment and recreation sector in New York City in February 2020, based on data from the New York State Department of Labor’s Current Employment Statistics. The additional individuals working in this sector as freelancers or self-employed persons are not captured in these data.
In April, after the statewide stay-at-home order went into effect on March 22 and all facilities were closed to the public, sector employment plummeted to 34,100 jobs, and it continued to fluctuate around that level through December. As of December 2020, employment had declined by 66 percent compared to one year earlier, the largest decline among all sectors in the City’s economy.
Employment in all subsectors was adversely affected, even though some facilities, such as zoos and botanical gardens, needed to keep staff on site to maintain exhibitions (see Figure 7).
FIGURE 7 - Arts, Entertainment and Recreation Employment, 2020
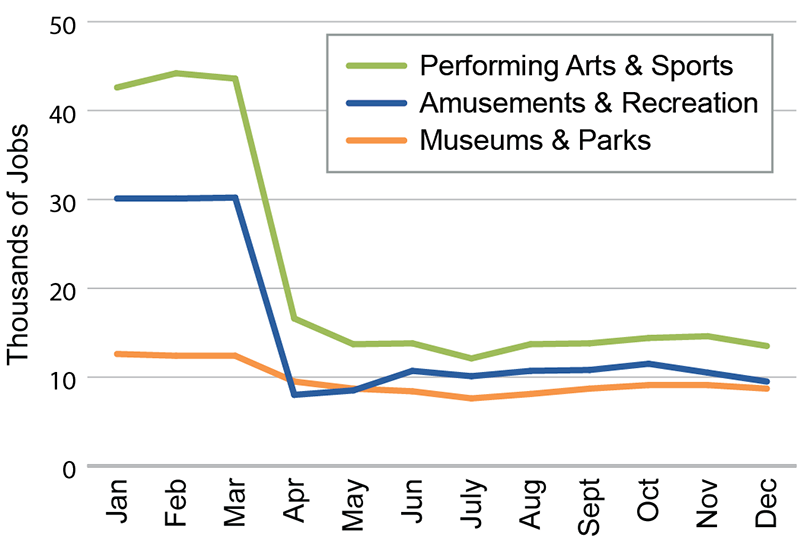
Sources: NYS Department of Labor; OSC analysis
Many of the sector’s establishments were included as part of later stages of New York State’s phased reopening, or not included in the reopening plan at all. For example, most establishments in performing arts and spectator sports, the largest employment subsector, have not been allowed to reopen. However, in early summer, some spectator sports and racetracks were permitted to operate, although with no fans in attendance. The U.S. Open Tennis Championship was also allowed to go forward in Queens at the end of the summer, also spectator-free.
Other openings were not permitted until the City entered Phase 4 (on July 20). Outdoor venues deemed to be low-risk, such as zoos and botanical gardens, began to open at the end of July with a maximum capacity of 33 percent. Bowling alleys were authorized to open on August 17, with a maximum capacity of 50 percent, and museums reopened on August 24 with a 25 percent maximum capacity. Gyms reopened on September 2 with a 33 percent capacity, but no group classes were allowed.5 State-licensed gaming facilities opened on September 9 at 25 percent of capacity. Even with the resumption of business in these areas, however, total sector employment has barely increased.
Budgets at arts and recreation establishments have been decimated. In order to raise revenues, performing arts organizations have turned to the Internet, streaming both live and taped performances for fees or suggested donations, and offering classes and seminars online. Some organizations have reimagined their annual fundraising occasions as virtual events. Gyms have held classes both online and outside. NYC & Company has begun a campaign encouraging residents to become tourists in their own city.
Some organizations and facilities that have already reopened claim they will have to make budget cuts because of reduced revenues due to capacity restrictions and diminished ticket sales. Most Broadway theaters do not expect to reopen until June 2021 at the earliest, and the Metropolitan Opera and the New York City Ballet announced they would not be reopening until September 2021.
Dr. Anthony S. Fauci, Director of the National Institute of Allergy and Infectious Diseases, said he believes indoor performing arts events may be able to restart in the fall of 2021. Reopening will depend on the number of people vaccinated and an evaluation by venues of their ventilation systems and other guidelines.
On December 10, 2020, the New York City Council passed legislation to create the “Open Culture” program, which will allow eligible organizations to hold free or ticketed arts and cultural events at outside public venues beginning in March 2021. The program continues until October 31, 2021, but could be extended through March 31, 2022. The City has compiled a list of approved locations. Permit application fees of $20 will apply and COVID-19 guidelines must be followed.
As part of his State of the State address in January 2021, Governor Cuomo announced the formation of the New York Arts Revival, a public-private initiative aimed at restarting live performing arts events throughout the state. As part of the Revival, NY PopsUp, a series of free ‘pop-up’ events, will be held starting in late February and continuing through Labor Day. The State will also partner with the Andrew W. Mellon Foundation to award grants to out-of-work artists and community arts groups. In addition, in the last few weeks the Governor has announced several reopening plans including large arenas at the end of February with capacity at 10 percent, movie theaters on March 5 with capacity at 25 percent limited to 50 patrons, indoor family entertainment centers on March 26 with capacity at 25 percent and outdoor amusement parks on April 9 with capacity at 33 percent. Both day and sleepaway camps will be allowed to operate this summer with health protocols forthcoming.
Taxable sales reported by vendors to the New York State Department of Taxation and Finance give some indication of revenue trends, although many components of the sector, such as live performances, are not subject to tax. For those subsectors that do collect sales tax, taxable sales declined by 76 percent between March and November 2020 compared to one year ago.
Womply, a software services company that tracks credit card transactions from hundreds of millions of cardholders, estimates that as of February 4, 2021, 59 percent of arts and entertainment businesses and 63 percent of sports and recreation venues have closed since the beginning of March, the highest among all other businesses reported by Womply, except for bars and lounges. However, given Womply’s methodology, some of the reported closures may be temporary.
Federal Programs
In late March, the Coronavirus Aid, Relief, and Economic Security (CARES) Act, a federal government economic stimulus package of more than $2 trillion, was signed into law. Several of its components were particularly helpful to workers and establishments in the arts, entertainment and recreation sector. Much of this relief was also renewed, or enhanced, through new legislation passed in December 2020.
The CARES Act established the Pandemic Unemployment Assistance (PUA) program, which expanded eligibility for unemployment insurance to independent contractors and self-employed workers, including many participants in this sector.
The PUA program allowed up to 39 weeks of benefits ending on or before December 31, 2020. States were given the option to participate in the program. Recipients were also eligible to receive an additional $600 per week through July 31, 2020, under the Federal Pandemic Unemployment Compensation.
The CARES Act also established the Paycheck Protection Program (PPP) and expanded the U.S. Small Business Administration’s existing Economic Injury Disaster Loan (EIDL) program. The PPP stopped accepting new loan applications on August 8, 2020.
In addition, the CARES Act earmarked funds for federal arts organizations. The Institute of Museum and Library Services, the National Endowment for the Arts, and the National Endowment for the Humanities each received between $50 million and $75 million to be distributed through grants, supporting various entities including the Frick Collection, the Lower East Side Tenement Museum, and the American Folk Art Museum, among many others.
A new federal relief package approved as part of the Consolidated Appropriations Act, 2021, in December 2020 extends and builds on the support provided by the CARES Act. The new legislation provides for another 11 weeks of pandemic unemployment assistance extending until March 14, 2021. Recipients would also receive an additional $300 per week in Federal Pandemic Unemployment Compensation.
The new federal relief package also includes $15 billion nationally for shuttered arts organizations (live independent venues, movie theaters and museums). The Small Business Administration will administer these new grants to venue operators (such as operators of live performing arts organizations, museums and cinemas), promoters, theatrical producers, talent managers and agencies. The maximum initial grant is $10 million for a single organization, with the possibility of additional funds if the venue remains closed for the first half of 2021. Arts organizations with the largest revenue losses (90 percent or more) are permitted to apply first, and all grantees must show a revenue drop of at least 25 percent, on a quarterly basis, compared to 2019. New York City has introduced Curtains Up NYC to provide application assistance.
The December 2020 federal relief package also reopens the PPP (with $284 billion in funding) through March 31, 2021, and provides for new EIDL grants. Provisions for the new round of PPP include adding types of eligible expenditures and separate allocations for minority-owned businesses, those with 10 or fewer employees, and those in low and moderate income communities. The PPP will also allow second loans, where organizations can show a 25 percent decrease in gross receipts from 2019, providing an additional lifeline.
The Census Bureau’s Phase 2 Small Business Pulse Survey data show New York State’s arts and recreation sector, like many others, relied mainly on the first round of PPP and EIDL programs to ease the impact of the pandemic. Very few respondents from the arts and recreation sector indicated that they used their own funds or turned to other federal programs or commercial banks for support.
The number of PPP loans approved for arts, entertainment and recreation organizations in New York City represented just under two-thirds of entities in the sector (excluding independent contractors, sole proprietors, and self-employed individuals). Organizations receiving loans were required to indicate the number of jobs they expected to retain (referred to as jobs reported). Employers receiving PPP loans reported retaining more than two-thirds (70 percent) of all jobs in the sector (see Figure 8).
FIGURE 8 - Arts, Entertainment and Recreation Sector PPP Loans Approved and Jobs Reported as a Share of the Sector’s Small Business Firms and Jobs
| Borough | Firms within the Sector | Employees within the Sector | PPP Loans Approved for the Sector | Jobs Reported by Sector Borrowers | Loans Approved as Share of Sector Firms | Jobs Reported as Share of Sector Jobs |
| Bronx | 129 | 1,710 | 89 | 753 | 68% | 44% |
| Brooklyn | 1,077 | 9,201 | 853 | 5,854 | 79% | 64% |
| Manhattan | 4,351 | 42,842 | 2,446 | 30,725 | 56% | 72% |
| Queens | 510 | 5,013 | 395 | 4,395 | 77% | 88% |
| Staten Island | 143 | 1,497 | 72 | 684 | 50% | 46% |
| NYC | 6,210 | 60,262 | 3,855 | 42,412 | 62% | 70% |
Note: All firms are those with fewer than 500 employees. These firms exclude independent contractors, sole proprietors and the self-employed. Columns may not add to totals due to rounding.
Sources: U.S. Small Business Administration; NYS Department of Labor; OSC analysis
Loan approvals as a share of the sector’s total establishments in each borough were highest in Brooklyn and Queens, while Manhattan had the second-lowest share after Staten Island. However, Manhattan had the second-highest share of PPP jobs reported relative to all jobs in this sector. This reflects that borrowing firms in Manhattan had a higher average number of jobs reported (13) than the average number of jobs per firm in the sector (10), based on data from the New York State Department of Labor.
Loans approved for the performing arts and spectator sports subsector accounted for most of the total approved for the entire sector (see Figure 9), and for just over half of all sector jobs reported by borrowers.
The number of PPP loans approved for museums and historical sites (293) almost equaled the number of firms in that subsector, while the number approved for performing arts and spectator sports (2,774) was just below two-thirds of the number of firms in that subsector.
FIGURE 9 - PPP Loans Approved for Arts, Entertainment and Recreation
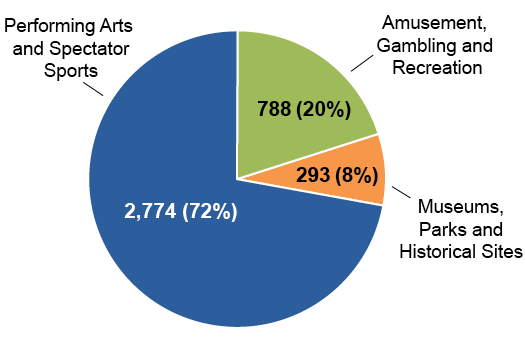
Sources: U.S. Small Business Administration; OSC analysis
The number of PPP loans approved for independent contractors, sole proprietors and self-employed individuals in the arts, entertainment and recreation sector totaled 1,824, nearly half of the number of loans given to all the other types of businesses combined in this sector. Most of these were for the performing arts and spectator sports subsector (94 percent).
Arts, Entertainment and Recreation: Keeping the Lights On
New York City’s arts, entertainment and recreation sector is a cornerstone of the City’s ability to attract businesses, residents and visitors alike. Yet the sector relies on audiences who gather to take part in shared experiences, and this way of life has been significantly disrupted by the pandemic. Arts and recreation face an uphill climb to recover from the damage wrought.
This sector is the only major employment sector in New York City that remains below half of its pre-pandemic employment levels. The operations of arts and recreation businesses have been severely limited by restrictions on congregate venues to manage public health risks.
The challenges facing the arts and entertainment sector require direct and impactful support from policy makers to maintain the City’s extensive cultural offerings, while ensuring that public health remains a foremost priority until the pandemic has subsided.
The federal, State and City governments have all recently stepped up efforts to address the special circumstances faced by this sector. While some venues may be able to restart operations and offer live performances through carefully developed State and City initiatives, particularly outdoor events, clearly, much of the sector may not be able to return to pre-pandemic attendance or subscriptions until vaccines have been widely distributed and it is once again safe for crowds to gather in most indoor spaces.
The new federal legislation recognizes the specific plight of the industry where closures are widespread and venues have limited ability to operate and raise revenue given the need to comply with public health regulations thus far. The legislation provides direct revenue relief through grants to shuttered businesses based on 2019 revenues. It allows for additional grants where closures last into the second half of 2021, providing extended support for establishments that continue to face obstacles reopening.
The extension of support for the unemployed, including independent contractors, will also help many individuals in the arts and recreation sector as will the expansion of the Paycheck Protection Program, though new action will need to be taken for Pandemic Unemployment Assistance to continue into the second half of the year if the reopening process continues slowly.
The State and City’s recent efforts have also augmented federal support. Efforts to hold events safely, including New York Arts Revival, should help not just restart the performing arts sector but provide lessons for spectator sports and other venues as well, by leveraging outdoor venues and enhanced rapid testing and safety protocols.
The City has also taken steps to expand technical services and simplify processes to help businesses create an online footprint, apply for grants and loan programs, and navigate the City’s permit process and COVID-19 regulations for events. More can be done as vaccinations increase, weather becomes warmer, rapid testing expands and safety guidelines continue to be refined to enable activity.
All these government efforts provide important aid to a vital sector of the economy and life of the City. Because of the length of the pandemic and the direct relationship between the congregation of large groups and the potential for super-spreader events, this sector is likely to face the hardest road to recovery and even more creative solutions will be needed.
The State and City must work in coordination to provide establishments with clear and achievable milestones for reopening and enable the use of outdoor space to expand audiences. Together, they can facilitate the flow of federal relief and healthcare supplies to individuals and businesses in the sector while expanding access to the vaccine. A strong and vibrant New York City requires the full presence of the cultural and physical amenities residents and tourists enjoy, anticipate and expect. Pursuing this path will help the City’s many stages keep the lights on.
1 The arts, entertainment and recreation sector will also be referred to as the arts and recreation sector in this report.
2 Unless otherwise indicated, data on employment and wages by place of work are from the New York State Department of Labor’s Quarterly Census of Employment and Wages (QCEW), and national data are from the U.S. Bureau of Labor Statistics. The arts, entertainment and recreation sector does not include film and television.
3 Neighborhoods in this report refer to the 55 U.S. Census-defined Public Use Microdata Areas (PUMAs) for New York City.
4 Data on arts, entertainment and recreation workers by place of residence are from the U.S. Census Bureau American Community Survey, 2019 1-year estimates, unless otherwise noted.
5 As COVID-19 cases surged in New York State in the late fall, Governor Cuomo announced that gyms must close by 10 p.m. starting November 13.
APPENDIX A – New York City Arts, Entertainment and Recreation Sector Workforce by Neighborhood of Residence and Establishments by Neighborhood of Location
| Neighborhood | Sector Workers | Share of Citywide Workforce | Share of Local Workforce by Demographic Group | Establishments | |||||
| Immigrant | White | Hispanic or Latino | Black or African American | Asian | Sector Firms | Share of Local Firms | |||
| Upper West Side / West Side | 8,038 | 6.3 | 18.2 | 79.5 | 0.0 | 18.9 | 0.0 | 463 | 5.4 |
| Hamilton Heights / Manhattanville / West Harlem | 7,918 | 6.2 | 21.2 | 45.7 | 28.5 | 12.3 | 2.0 | 701 | 3.2 |
| Chelsea / Clinton / Midtown Business District | 7,289 | 5.7 | 20.9 | 74.9 | 0.0 | 6.7 | 18.4 | 1,921 | 4.1 |
| Washington Heights / Inwood / Marble Hill | 6,083 | 4.7 | 17.1 | 60.3 | 21.9 | 9.5 | 4.8 | 84 | 2.6 |
| Battery Park City / Greenwich Village / Soho | 5,369 | 4.2 | 15.7 | 78.5 | 8.6 | 1.2 | 11.7 | 751 | 3.2 |
| Astoria / Long Island City | 4,430 | 3.4 | 2.9 | 76.0 | 16.6 | 4.0 | 1.6 | 102 | 1.7 |
| Brooklyn Heights / Fort Greene | 4,172 | 3.2 | 6.9 | 67.4 | 6.9 | 9.8 | 5.7 | 233 | 3.5 |
| Upper East Side | 4,128 | 3.2 | 12.7 | 71.0 | 4.5 | 22.3 | 0.0 | 267 | 2.0 |
| Greenpoint / Williamsburg | 4,056 | 3.2 | 18.6 | 69.1 | 16.3 | 2.5 | 4.0 | 196 | 2.8 |
| Bedford-Stuyvesant | 4,018 | 3.1 | 10.5 | 59.6 | 7.6 | 20.5 | 1.8 | 33 | 1.6 |
| Chinatown / Lower East Side | 3,475 | 2.7 | 22.7 | 61.9 | 28.0 | 0.0 | 10.1 | 227 | 3.7 |
| Ridgewood / Glendale / Middle Village | 3,441 | 2.7 | 22.2 | 79.2 | 9.4 | 5.8 | 5.6 | 35 | 0.9 |
| Bushwick | 3,400 | 2.6 | 26.9 | 48.6 | 29.5 | 6.4 | 10.6 | 47 | 1.9 |
| Crown Heights North / Prospect Heights | 3,324 | 2.6 | 2.6 | 69.0 | 14.5 | 8.8 | 3.4 | 75 | 3.1 |
| Central Harlem | 3,248 | 2.5 | 4.4 | 27.3 | 14.7 | 49.5 | 4.8 | 58 | 2.7 |
| Sunnyside / Woodside | 3,112 | 2.4 | 15.7 | 47.0 | 30.0 | 1.9 | 21.1 | 84 | 1.8 |
| Park Slope / Carroll Gardens / Red Hook | 2,864 | 2.2 | 21.6 | 86.6 | 2.9 | 2.5 | 8.0 | 212 | 4.3 |
| Murray Hill / Gramercy / Stuyvesant Town | 2,706 | 2.1 | 13.5 | 81.0 | 8.4 | 5.0 | 0.0 | 378 | 2.3 |
| Crown Heights S. / Prospect Lefferts / Wingate | 2,224 | 1.7 | 9.9 | 43.7 | 2.9 | 37.1 | 3.8 | 18 | 1.2 |
| Morris Heights / Fordham South / Mount Hope | 1,846 | 1.4 | 58.0 | 4.9 | 86.1 | 9.0 | 0.0 | 3 | 0.2 |
| Elmhurst / South Corona | 1,844 | 1.4 | 49.6 | 24.5 | 53.1 | 0.0 | 16.9 | 8 | 0.4 |
| Wakefield / Williamsbridge / Woodlawn | 1,791 | 1.4 | 65.5 | 7.8 | 13.0 | 75.0 | 0.0 | 6 | 0.4 |
| Castle Hill / Clason Point / Parkchester | 1,779 | 1.4 | 4.6 | 4.3 | 44.5 | 47.3 | 3.8 | 7 | 0.4 |
| Flatbush / Midwood | 1,749 | 1.4 | 49.2 | 71.4 | 20.9 | 3.3 | 0.0 | 26 | 0.8 |
| Bensonhurst / Bath Beach | 1,727 | 1.3 | 43.9 | 50.4 | 0.0 | 0.0 | 42.7 | 26 | 0.6 |
| Borough Park / Kensington / Ocean Parkway | 1,681 | 1.3 | 12.4 | 95.1 | 4.9 | 0.0 | 0.0 | 27 | 0.5 |
| Co-op City / Pelham Bay / Schuylerville | 1,667 | 1.3 | 12.6 | 40.9 | 46.9 | 12.2 | 0.0 | 26 | 1.7 |
| Concourse / Highbridge / Mount Eden | 1,597 | 1.2 | 67.5 | 7.0 | 73.4 | 19.6 | 0.0 | 13 | 0.8 |
| New Springville / South Beach | 1,550 | 1.2 | 25.0 | 81.5 | 5.6 | 12.9 | 0.0 | 45 | 1.3 |
| Queens Village / Cambria Heights / Rosedale | 1,542 | 1.2 | 42.4 | 7.1 | 6.5 | 55.9 | 17.4 | 18 | 0.7 |
| Jamaica / Hollis / St. Albans | 1,500 | 1.2 | 40.3 | 0.0 | 10.1 | 89.9 | 0.0 | 15 | 0.4 |
| Jackson Heights / North Corona | 1,410 | 1.1 | 48.8 | 31.8 | 56.7 | 0.0 | 11.5 | 28 | 0.8 |
| Pelham Parkway / Morris Park / Laconia | 1,395 | 1.1 | 34.0 | 34.3 | 18.9 | 43.4 | 0.0 | 14 | 0.6 |
| Riverdale / Fieldston / Kingsbridge | 1,388 | 1.1 | 0.0 | 73.6 | 26.4 | 0.0 | 0.0 | 31 | 1.7 |
| East Harlem | 1,342 | 1.0 | 3.3 | 57.9 | 19.9 | 6.6 | 3.3 | 25 | 1.3 |
| Flushing / Murray Hill / Whitestone | 1,318 | 1.0 | 31.5 | 60.5 | 4.6 | 0.0 | 34.8 | 76 | 0.8 |
| Forest Hills / Rego Park | 1,229 | 1.0 | 9.3 | 68.3 | 15.9 | 0.0 | 15.8 | 33 | 0.9 |
| Briarwood / Fresh Meadows / Hillcrest | 1,228 | 1.0 | 16.9 | 27.9 | 26.5 | 10.0 | 26.8 | 17 | 0.6 |
| Bedford Park / Fordham N. / Norwood | 1,218 | 0.9 | 32.3 | 3.0 | 59.0 | 17.5 | 20.5 | 11 | 0.7 |
| Belmont / Crotona Park East / East Tremont | 1,211 | 0.9 | 36.1 | 23.2 | 15.9 | 60.9 | 0.0 | 5 | 0.2 |
| Canarsie / Flatlands | 1,200 | 0.9 | 46.8 | 5.8 | 3.9 | 87.9 | 2.4 | 27 | 0.9 |
| Bayside / Douglaston / Little Neck | 1,139 | 0.9 | 63.8 | 36.2 | 3.9 | 0.0 | 60.0 | 37 | 1.1 |
| Bay Ridge / Dyker Heights | 1,084 | 0.8 | 31.2 | 86.3 | 0.0 | 0.0 | 13.7 | 23 | 0.7 |
| Richmond Hill / Woodhaven | 1,051 | 0.8 | 65.4 | 44.2 | 20.3 | 5.8 | 23.3 | 16 | 0.6 |
| Hunts Point / Longwood / Melrose | 1,041 | 0.8 | 28.4 | 0.0 | 66.9 | 33.1 | 0.0 | 13 | 0.4 |
| Sheepshead Bay / Gerritsen Beach / Homecrest | 1,027 | 0.8 | 47.1 | 81.1 | 0.0 | 0.0 | 18.9 | 40 | 0.8 |
| Far Rockaway / Breezy Point / Broad Channel | 929 | 0.7 | 37.1 | 42.6 | 0.0 | 57.4 | 0.0 | 14 | 1.1 |
| Sunset Park / Windsor Terrace | 868 | 0.7 | 11.5 | 78.3 | 11.1 | 0.0 | 10.6 | 47 | 1.0 |
| Port Richmond / Stapleton / Mariner's Harbor | 841 | 0.7 | 0.0 | 76.2 | 10.9 | 9.2 | 0.0 | 47 | 1.4 |
| East Flatbush / Farragut / Rugby | 836 | 0.7 | 62.8 | 0.0 | 35.3 | 64.7 | 0.0 | 10 | 0.7 |
| Tottenville / Great Kills / Annadale | 835 | 0.7 | 46.3 | 93.9 | 0.0 | 0.0 | 0.0 | 52 | 1.8 |
| Brownsville / Ocean Hill | 832 | 0.6 | 0.0 | 8.7 | 37.7 | 53.6 | 0.0 | 6 | 0.5 |
| Howard Beach / Ozone Park | 764 | 0.6 | 67.4 | 5.9 | 39.1 | 25.5 | 29.5 | 21 | 1.1 |
| East New York / Starrett City | 597 | 0.5 | 15.6 | 26.6 | 0.0 | 27.0 | 30.8 | 4 | 0.2 |
| Brighton Beach / Coney Island | 58 | 0.0 | 100.0 | 100.0 | 0.0 | 0.0 | 0.0 | 31 | 1.2 |
| Total | 128,400 | 3.1 | 22.5 | 55.8 | 17.5 | 15.6 | 7.6 | 6,250 | 2.3 |
Sources: U.S. Census Bureau, American Community Survey, 2019 1-year estimates; NYS Department of Labor, QCEW 2019; OSC analysis