
Economic and Policy Insights
Existential Questions Facing National Public Transit Systems Create New Fiscal Pressures for MTA
July 2022
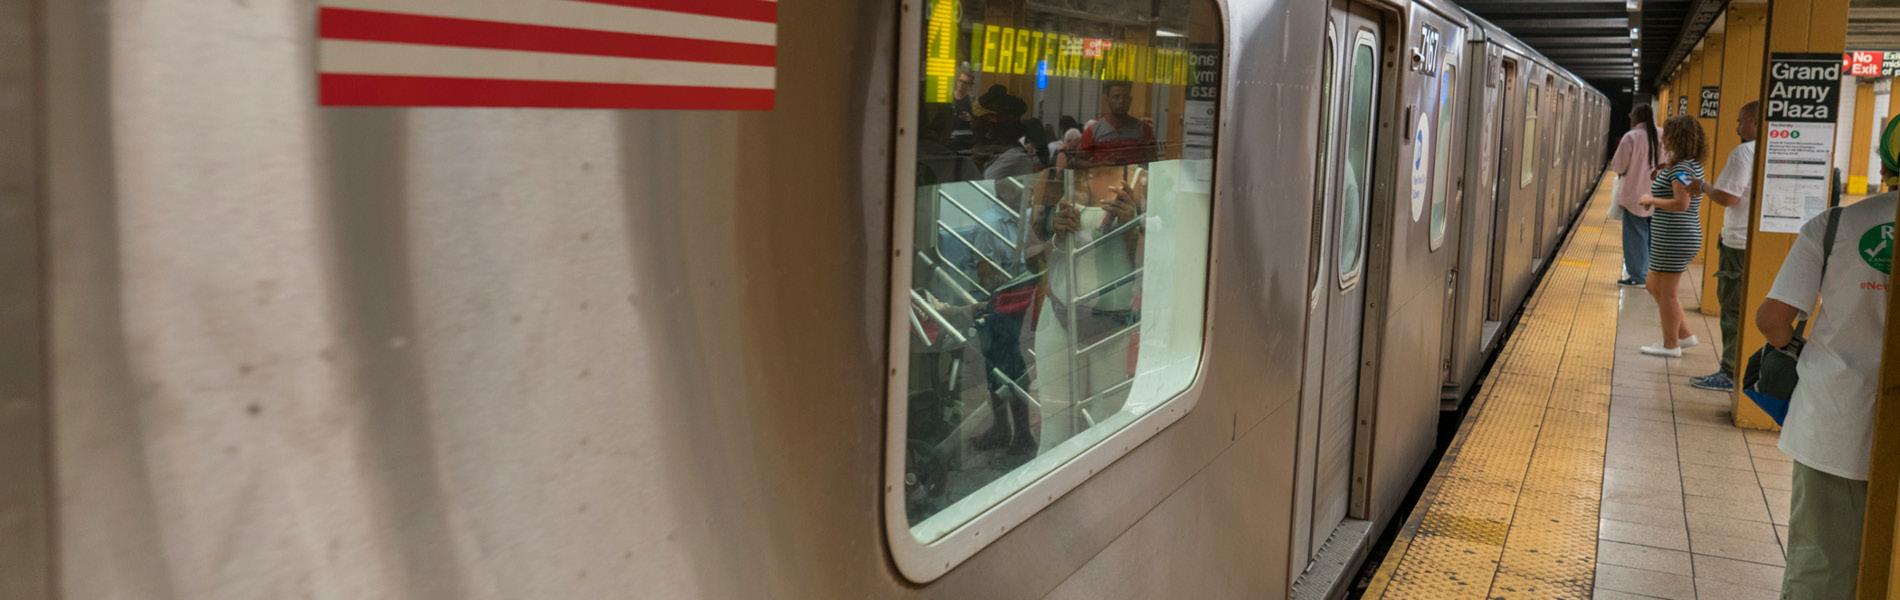
The Metropolitan Transportation Authority (MTA) is the largest transit system in the nation, providing nearly 40 percent of the nation’s public transit trips. In 2019, the MTA provided 3.8 billion trips across its subway, bus, and commuter railroad services. The pandemic led to a dramatic drop in riders – and ridership revenue – for transit systems across the country.1 Nevertheless, the continued provision of service is especially critical to the economic health of New York City and its residents. More than half of City residents used public transit to commute to work in 2019. The New York City metro area also had the largest share of commuters who use public transit among comparable metro areas served by combined bus and heavy rail (subway) operations in the U.S. (see Figure 1).
The use of public transit in New York City fosters foot traffic and economic activity in and around travel hubs, neighborhood stations and bus stops. Public transit also effectively improves the affordability of living in New York City by reducing the need for a vehicle – the City’s car ownership rates are among the lowest for all major metropolitan areas in the country. New York City Transit fares have remained at $2.75 for a bus or subway ride throughout the pandemic, despite rapid inflation and rising prices (including the price of gasoline, which exceeded an average of $4.88 statewide as of July 6, 2022).2
FIGURE 1 – Commute by Public Transit and Car Ownership, 2019
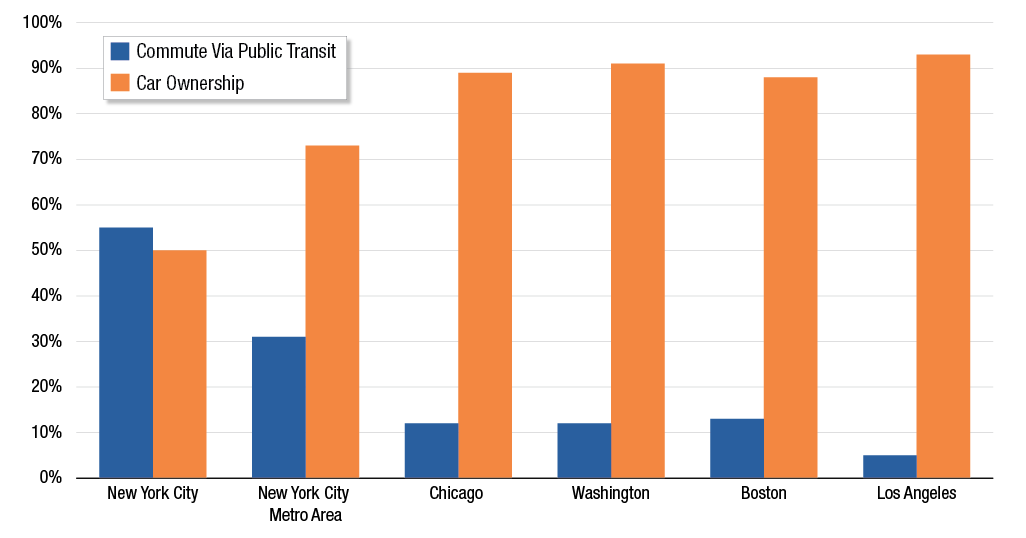
Sources: U.S. Census American Community Survey, 2019 1-year estimates; OSC analysis
Note: Commute via transit includes, subway and elevated rail, bus, commuter rail, light rail, streetcar or trolley and ferryboat services.
Ridership and farebox revenue at the MTA were particularly hard hit relative to other transit agencies both due to the severe impact of the pandemic on New York City, regional density of employment, the number of jobs that were lost and a higher reliance on mass transit in the New York metropolitan area. New York City Transit is also relatively more reliant on fare revenue to manage operations.
Overall ridership growth over the decade preceding the pandemic and regular fare increases supported a relatively high farebox operating ratio – the amount that fares cover operating expenses, excluding non-operating items like debt service. New York City Transit experienced a more severe decline in both ridership and fare revenues than most other large systems that operate both subways and buses (see Figure 2). According to the latest year-to-date data from May 2022, the farebox operating ratio for New York City Transit was 31.9 percent, compared to the budgeted 40 percent, a gap of more than 8 percent. In 2019, the farebox operating ratio for New York City Transit was 52.8 percent and 51.1 percent for the MTA agency-wide.
The MTA’s ability to close the financial gap between pre-pandemic, budgeted and actual farebox operating ratios, not only for the subway and buses but for the Long Island Rail Road and Metro-North Railroad as well, is a challenge that will dictate the options the MTA has to close its structural budget gap once federal relief is exhausted.
FIGURE 2 – Ridership and Farebox Revenue Change, 2019 vs. 2020
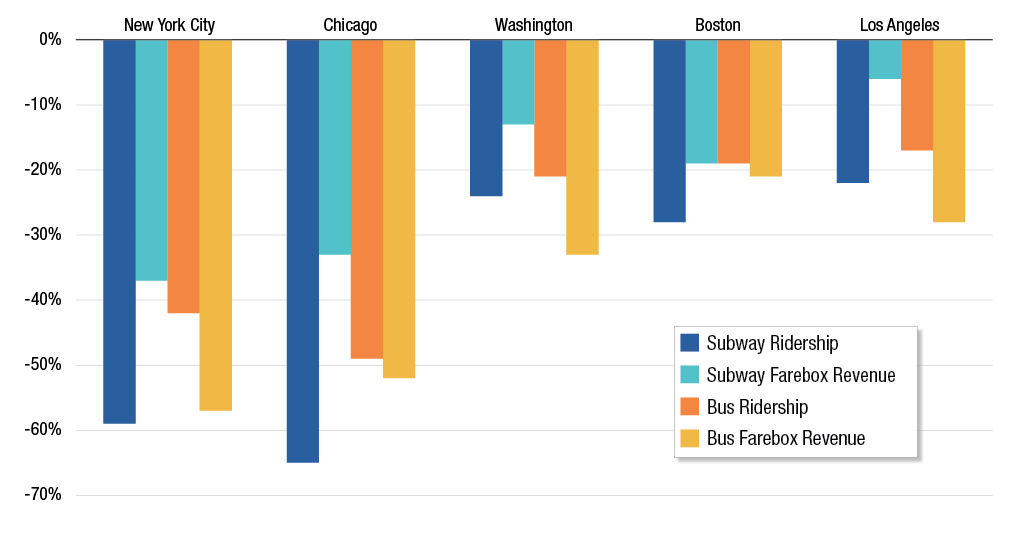
Sources: National Transit Database; OSC analysis
Even as ridership fell dramatically, there was pressure to continue to provide transit service across the country to support economic recovery, especially as federal aid was provided to bridge an anticipated period of depressed ridership and associated revenue. Many transit systems, including the MTA, are now providing service levels which approach, or in some cases exceed, pre-pandemic levels using the number of revenue hours and revenue miles of service. Subway revenue hours, which include periods in between runs where a subway car is in service, are now over 100 percent compared to the same period in 2019 (see Figure 3). In some cases, services also reflect changes that focus on supporting those who are most heavily reliant on public transit. The MTA, working with the New York City Department of Transportation, has also taken steps to explore increasing rapid bus service in certain corridors in the outer boroughs.
FIGURE 3 – Revenue Miles and Revenue Hours, Subway and Bus, April 2019 vs. April 2022
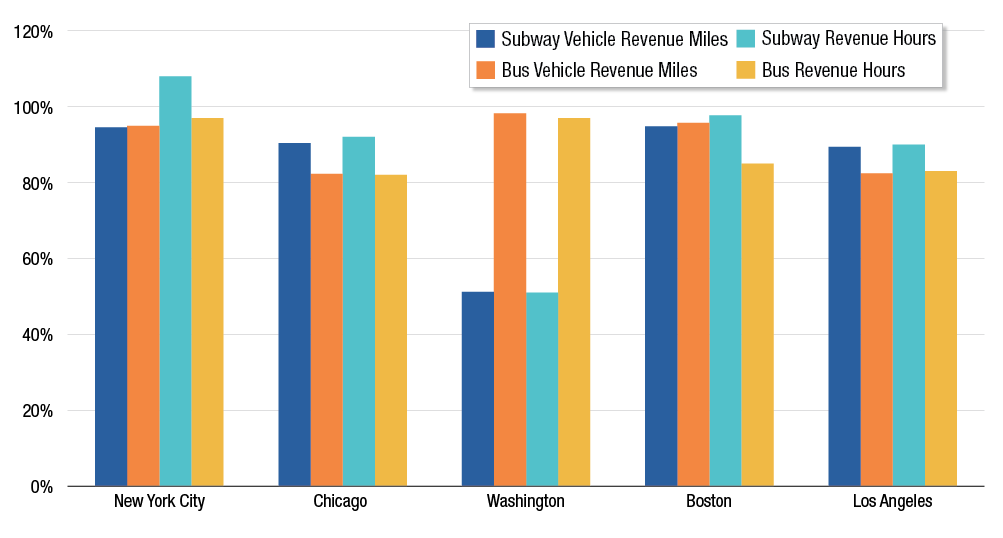
Sources: National Transit Database; OSC analysis
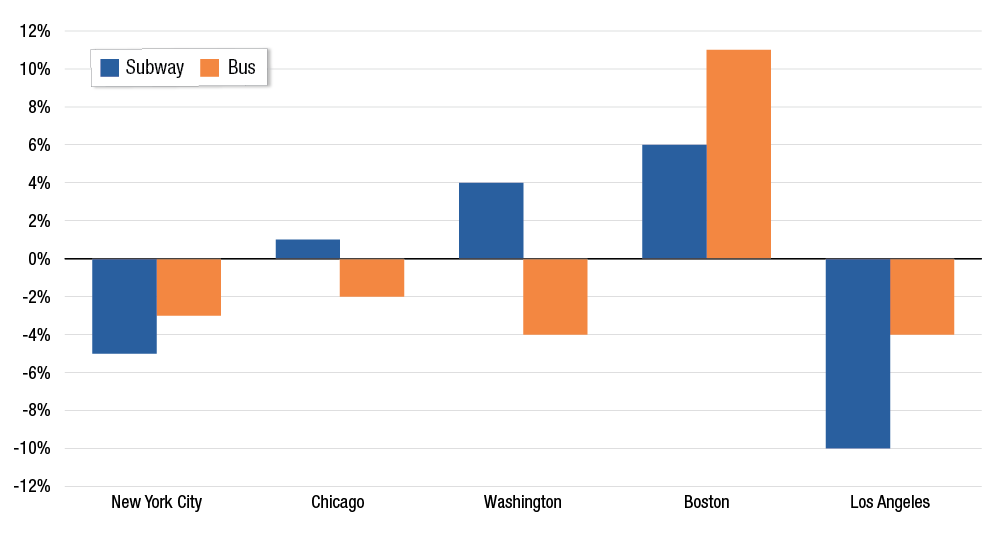
The MTA was able to reduce both subway and bus operating costs in 2020 as services were dramatically cut (see Figure 4). However, the operating costs of providing public transit services rose in 2021 as service was restored, and will continue to do so, even as ridership revenue remains well below 2019 levels. Three out of four components of subway operating costs declined in 2020, including general administration, vehicle maintenance, and facility maintenance, better than most peers. Subway vehicle operation costs at the MTA rose the most among comparable systems, however, most likely due to increased overtime as employee availability dropped.
In addition, while New York City Transit operating costs for subways and local buses declined by 4.4 percent in 2020, service delivery declined by substantially more, indicating that reductions in service do not lead to proportional declines in costs due to the MTA’s cost structure, much of which is fixed. Reductions in service also may lead to a reduction in economic activity and make it more difficult to justify regular fare increases, which are currently planned to help close future budget gaps by providing consistent revenue to the system that is commensurate with its operations. Understanding the reductions in component costs in 2020 that did not directly affect service may provide some insight on how the MTA can deliver on its cost efficiency and savings programs.
FIGURE 4 – Change in Subway and Bus Operating Expenses, 2019 vs. 2020
Sources: National Transit Database; OSC analysis
The MTA faces the difficult task of determining whether a recalibration of service to meet shifting trends in demand will be necessary to help manage cost growth and at the same time improve its most sustainable form of revenue: fares from increased ridership. Adjusting service to identify cost savings is often made in the form of reductions to service. However, as an example, the MTA may be able to generate cost efficiencies by increasing the number of trains per hour which may help to improve its farebox operating revenues by adding service to meet greater demand outside of Manhattan, or at different times of day or of the week.
In June, weekend ridership for the subway was 69 percent of 2019 levels while weekday ridership was at 59 percent (see Figure 5). Bus ridership, meanwhile, was higher on weekdays than weekends. In June, weekend ridership on the Long Island Rail Road and Metro-North Railroad averaged about 94 percent and 101 percent, respectively, of 2019 levels, while weekday ridership averaged 63 percent and 61 percent.3 If sustained shifts to office commuting and greater demand for off-peak service continue, the MTA may be able to identify opportunities to provide service that is better aligned with new demand, while potentially generating cost efficiencies and creating savings.
FIGURE 5 – Weekday Subway and Bus Ridership Return Rates and Office Occupancy Rates
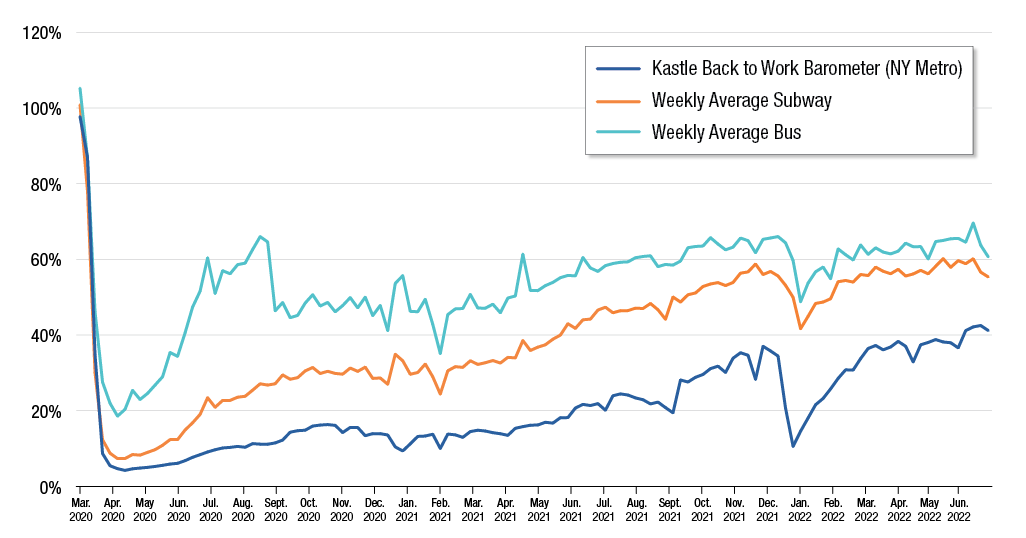
Sources: Kastle Systems; Metropolitan Transportation Authority; OSC analysis
Note: Return to office data calculated by month using starting point of weekly Kastle data.
Ultimately, the MTA’s ability to provide safe and reliable service is tied to the gap between its revenues and costs and how it intends on closing this budget gap. The MTA financial plan includes the use of debt to borrow for operating costs in 2025, a stopgap measure that will not be paid until after 2053 and will only address one to two years of issues before requiring new solutions. The MTA’s currently planned budget gap in 2025 without this stopgap measure would be nearly $500 million, a figure that could double as ridership projections are revised to reflect a new normal. Past OSC analysis suggests that the MTA could lose $500 million per year if regular commuting days range between one and two days per week. Tax revenues, particularly those related to real estate transactions in the Metropolitan Transportation Commuter District (a 12-county regional service area), may also be revised downward in a rising interest rate environment, which may pressure asset prices and reduce transaction activity.
In recent months, some legislators have discussed utilizing congestion pricing, whose timeline remains at risk, for closing these budget gaps. Using these funds for operations, while tempting, would create a substantial hole in the MTA’s capital program. Given the need for continued debt issuance to undertake capital projects, this diversion of funding would worsen the agency’s debt burden. The $1 billion in annual projected funds from congestion pricing would also not fully close the operating budget gaps on their own, including debt service and excluding extraordinary federal aid, underlining the importance of both cost and revenue approaches to bringing the MTA’s budget into long-term structural balance. After 2025, federal funding will no longer be available and deficit financing is not planned to be used resulting in a $2 billion or more structural deficit. This similar large deficit can be seen before 2025 when planned available federal funding and deficit financing are excluded from the MTA’s budget forecasts (see Figure 6).
FIGURE 6 – MTA Forecasted Operating Revenues Compared to Operating Expenses
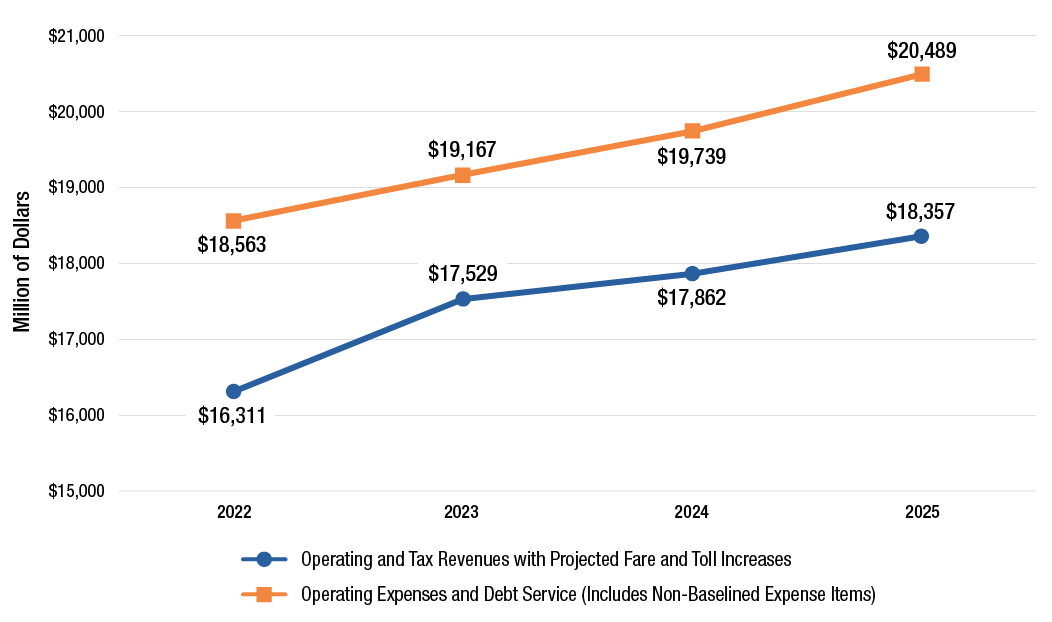
Sources: Metropolitan Transportation Authority, February Financial Plan 2022-2025; OSC analysis
The MTA must continue to be creative in taking measures to boost ridership, but stakeholders may have to come to terms with enhancing or identifying new sources of revenue and cost savings and efficiencies, including recalibrating service, if the agency is to achieve structural budgetary balance once federal aid runs out. The MTA must also consider which of its capital projects are most critical in case it needs to prioritize its capital plan to provide budgetary flexibility. The MTA should also continue to provide updates to its board on the pace and trajectory of revenue projections and the status of its savings programs, while simultaneously providing options for its board, the public and legislators on how it will close gaps further, what support it needs to do so, and what the potential impact of such changes will have on services and the regional economy.
Endnotes
1 Unless otherwise noted, references to transit systems by city (or county) name are as follows: New York City is New York City Transit; Chicago is the Chicago Transit Authority; Washington is the Washington Metropolitan Area Transit Authority; Los Angeles is the Los Angeles County Metropolitan Authority; and Boston is the Massachusetts Bay Transportation Authority.
2 American Automobile Association, State Gas Price Averages, Retrieved on July 6, 2022 from https://gasprices.aaa.com/state-gas-price-averages.
3 June weekday numbers do not include June 20 when Juneteenth was observed. This was not a holiday in 2019 so the day was removed for comparability purposes.