

New York City’s Uneven Recovery
An Analysis of Labor Force Trends
May 2022
Highlights
- Prior to the pandemic, in February 2020, the City had a smaller labor force participation rate (60.6 percent) than the rest of the State (61.3 percent), and both were below the national figure (63.4 percent).
- Females, including those with children, saw their labor force participation rates climb above pre-pandemic levels in 2021, while male participation declined to 65.5 percent, its lowest level in 20 years. Black males also saw their unemployment rate continue to rise in 2021.
- The labor force participation rate of non-college-educated workers declined by 1.9 points between 2019 and 2021 to 49.4 percent, compared to a decline of 1 point for college-educated workers to 74.1 percent.
- The labor force participation rate of young workers (those aged 16 to 24) dropped 2.8 points between 2019 and 2021 to 41.6 percent, and they were the only age group where the unemployment rate continued to rise in 2021 to 20.9 percent.
- The labor force participation rate of people with disabilities rose by 4.8 points between 2019 and 2021 to 17.5 percent, narrowing the gap with people without disabilities.
- The labor force participation rate of noncitizen immigrants declined by 1.6 points between 2019 and 2021 to 62.1 percent, more than for citizens (who saw a decline of 0.5 points to 59.1 percent), the opposite trend from the nation.
As New York City enters the third year of the COVID-19 pandemic, the City lags behind the rest of New York State and the nation both in restoring pandemic job losses and in rebounding to pre-pandemic levels of unemployment. Less than 71 percent of the City’s pandemic-induced job losses have returned, and unemployment remains high at 6.5 percent. Moreover, the recovery has been uneven, with high-wage economic sectors generally faring better than low-wage sectors.
The unevenness of the recovery is also rooted in the demographic and socioeconomic makeup of the labor force, including gender, age, race and ethnicity, education, disability status, citizenship status and household type. Some of these groups have been faced with chronic, systemic inequities. The pandemic exacerbated these inequities and created additional challenges, as family obligations and health concerns have influenced labor force participation rates.
While many of the challenges affecting particular demographic groups have been reported at the national level, the more prolonged impact of the pandemic on employment in New York City warrants further analysis and targeted policy responses. This report aims to understand the main differences in labor force participation among the City’s workers. A broad-based improvement in employment opportunities that acknowledges these differences is essential for the City to achieve a robust and durable economic recovery. Realizing the City’s full potential requires a strong workforce development pipeline tailored to those impacted disproportionately by the pandemic, and an expansion of job opportunities.
City’s Employment Recovery Lags Behind State and Nation
At the outset of the pandemic, from February to April 2020, employment in the City decreased by 21 percent (971,800 jobs, seasonally adjusted). As the nation’s initial epicenter of the COVID-19 pandemic, the City experienced more significant employment disruption when compared to other places. Therefore, this percentage is greater than in the rest of the State (20 percent) and in the nation overall (14 percent). Two years later, as of March 2022, the City has recovered less than 71 percent of the jobs lost in March and April 2020. The rest of the State has recovered 82 percent. As of April 2022, the nation has recovered 95 percent.1
While the City, State and national economies suffered heavily at the onset of the pandemic, they all resumed job growth in May 2020 after losing jobs in March and April. As of March 2022, the City has not fully regained its pandemic job losses in any economic sector except for information and health care (see Figure 1). The City does not expect its pandemic job losses to return fully until 2024.
FIGURE 1 – Pandemic Jobs Lost and Regained in New York City by Economic Sector, March 2022
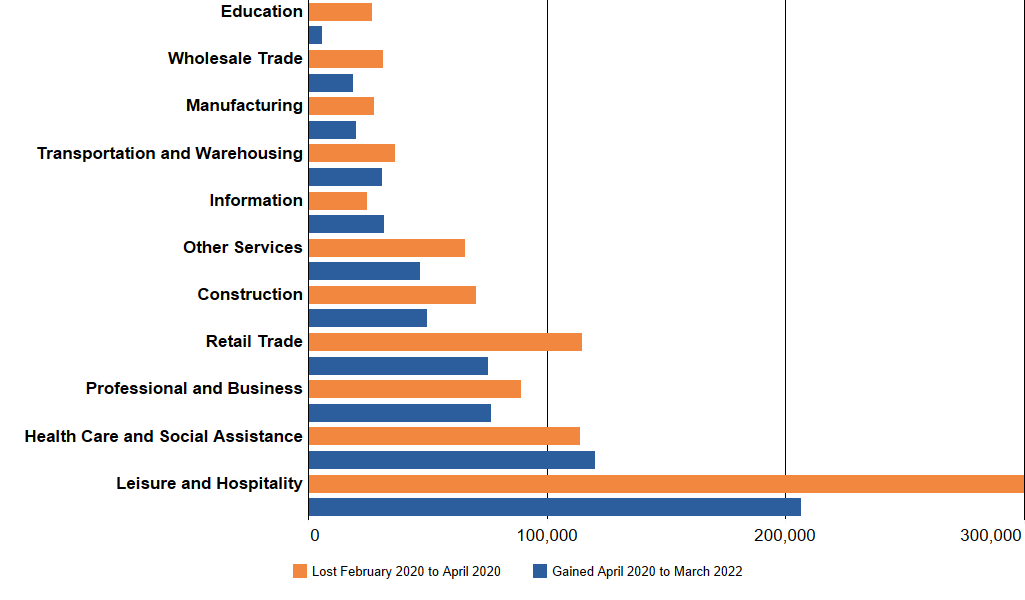
Note: Figures are not seasonally adjusted.
Sources: NYS Department of Labor, Current Employment Statistics; OSC analysis
The nation has either recovered or nearly recovered its pandemic job losses in many economic sectors.2 As discussed in the following sections, many of the economic differences observed across individuals in different demographic groups are explained, in part, by their employment in hard-hit economic sectors that have been slow to recover their early pandemic job losses.
A slow recovery of pandemic job losses has left the City with an unemployment rate that remains stubbornly higher than the pre-pandemic rate (see Figure 2). As of March 2022, the City’s unemployment rate is still 2.8 points higher than the February 2020 level (6.5 percent compared to 3.7 percent, seasonally adjusted), while the nation’s rate is only one-tenth of a point higher (3.6 percent compared to 3.5 percent).3 The rest of the State reached its February 2020 rate of 4.0 percent by October 2021.
FIGURE 2 – Unemployment Rates: City, Rest of State and Nation, January 2020 to March 2022
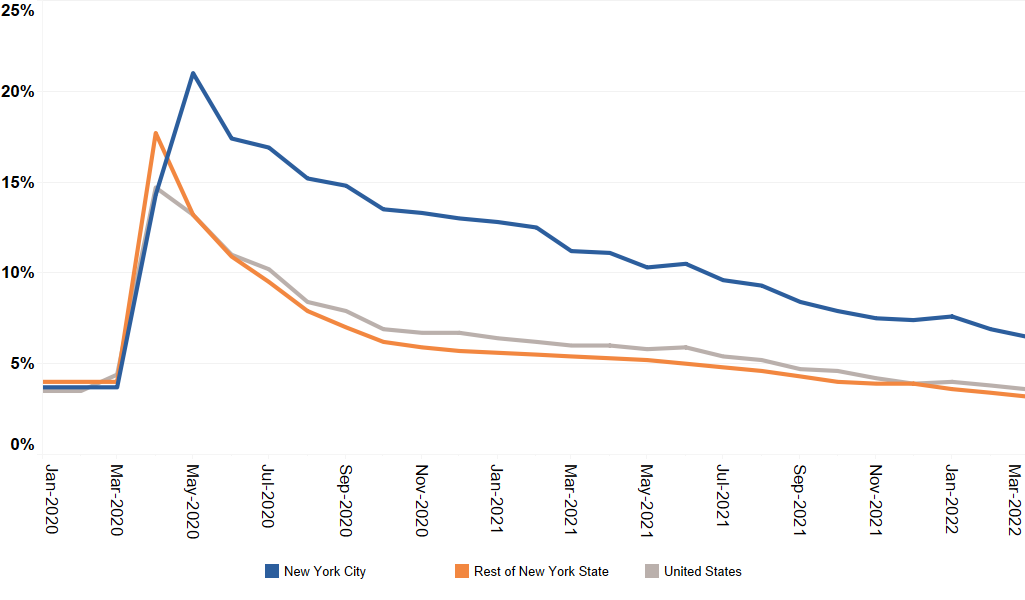
Sources: NYS Department of Labor, Local Area Unemployment Statistics; U.S. Bureau of Labor Statistics, Current Population Survey; OSC analysis
The long-term unemployed, or those who have been laid off and seeking work for 27 weeks or more (see Figure 3), have made up a consistently larger share of the unemployed population since the pandemic began than in the months before. In March 2021, one year after the pandemic began, approximately 69 percent of job seekers in the City were considered long-term unemployed, surpassing Great Recession levels (59 percent at its highest).
FIGURE 3 – Duration of Unemployment Among Laid-Off Individuals Seeking Work in New York City, January 2020 to March 2022
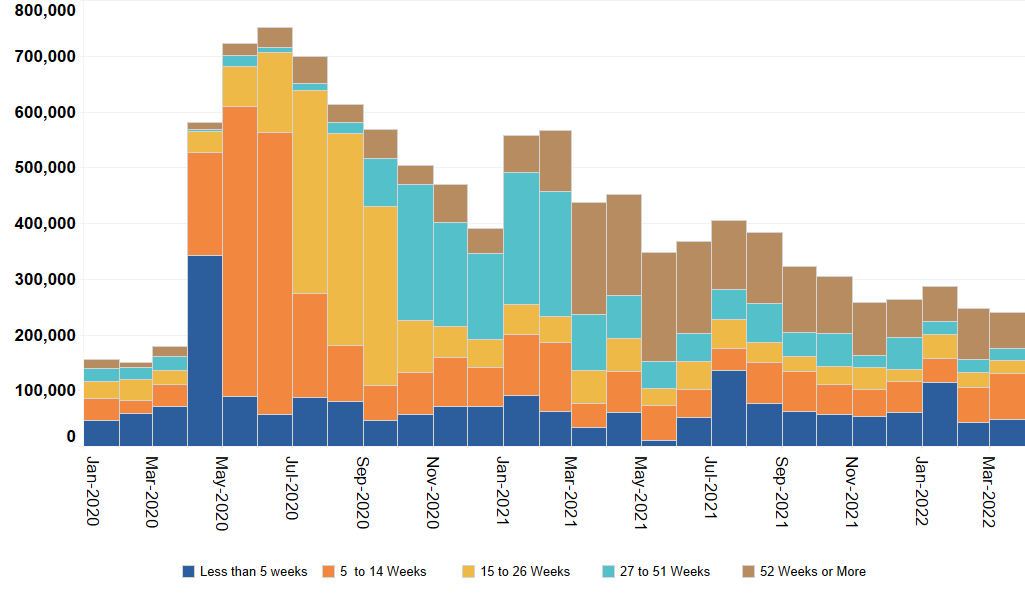
Sources: U.S. Bureau of Labor Statistics, Current Population Survey; OSC analysis
The City’s long-term unemployment trends remain more concerning than in the rest of the State and the nation. The gaps between the long-term unemployed in the City and those in the rest of the State and nation were much smaller prior to the pandemic than March 2021 levels (see Figure 4). The gap between the City and the nation is still relatively large two years into the pandemic.
FIGURE 4 – Long-Term Unemployed Share of Job Seekers by Geography, March 2020 to March 2022
| Period | New York City | Rest of New York State | City-Rest of State Gap | United States | City-Nation Gap |
|---|---|---|---|---|---|
| March 2020 | 25% | 11% | 14 | 17% | 8 |
| March 2021 | 69% | 49% | 19 | 43% | 26 |
| March 2022 | 36% | 22% | 14 | 24% | 11 |
Notes: Long-term unemployed individuals are those who were laid off and have been seeking work for 27 weeks or more. Gaps refer to percentage points and are subject to rounding.
Sources: U.S. Bureau of Labor Statistics, Current Population Survey; OSC analysis
Labor Force Participation Nears Pre-Pandemic Levels
While unemployment rates are helpful for learning about the population who are seeking but unable to find work, they do not tell the whole story, since they do not account for the population who are no longer seeking work and therefore have dropped out of the labor force entirely. The labor force participation rate, which is the sum of employed and unemployed people as a share of the population that is of working age (those aged 16 and over), can provide additional information that is useful for understanding the overall employment situation.
Prior to the pandemic, in February 2020, the City had a smaller labor force participation rate (60.6 percent of about 7.1 million working age people) than the rest of the State (61.3 percent of about 9.1 million working age people), and both the City and the State's rates were below the national figure (63.4 percent of about 260 million working age people; see Figure 5).4
FIGURE 5 – Labor Force Participation Rates: City, Rest of State and Nation, January 2020 to March 2022
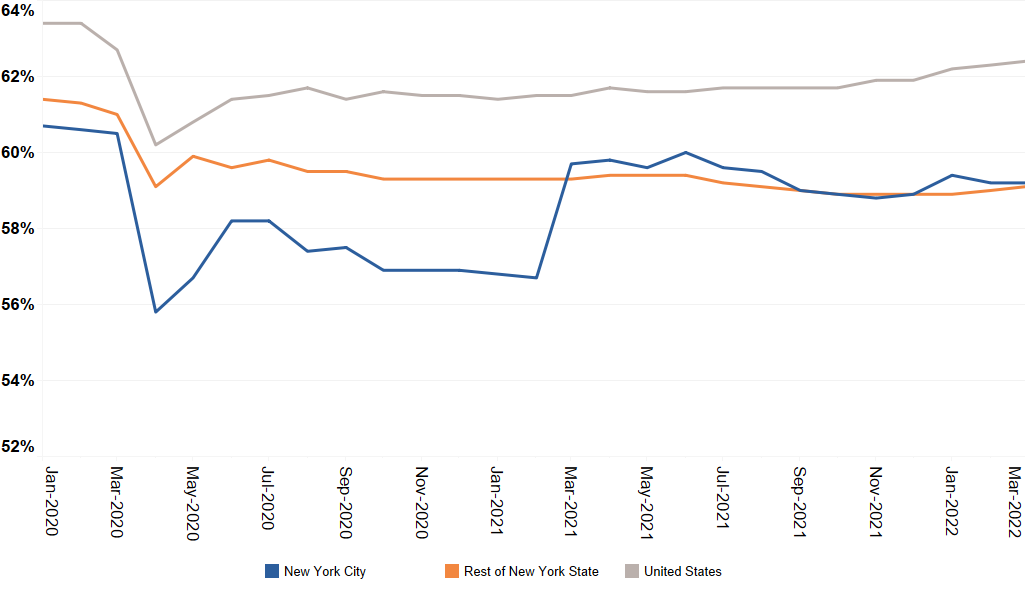
Sources: NYS Department of Labor, Local Area Unemployment Statistics; U.S. Bureau of Labor Statistics, Current Population Survey; OSC analysis
At the onset of the pandemic, many people nationwide lost their jobs and did not or could not seek work for a variety of reasons, including retirement, mental and physical health and wellness, or family obligations. This trend was more pronounced in the City, as the labor force participation rate dropped to 55.8 percent in April 2020, the lowest rate in 20 years. This was a 4.7 point drop from its February 2020 level and greater than the decline in the nation (3.2 points). As of March 2022, the labor force participation rate in the City is 59.2 percent, 1.4 points lower than its February 2020 level. The rate in the nation is 62.4 percent, 1.0 point lower.
While labor force participation rates in both the City and the nation are much closer to their February 2020 levels, this is not the case for unemployment rates, as discussed above. The differences in labor force participation and unemployment rates could be due to a number of reasons. Generally, as the number of people who have stopped looking for work increases, so does the unemployment rate, due to a smaller labor force pool. However, the interplay between labor force participation and unemployment rates are not always as straightforward, given population shifts. For example, the City’s total labor force participation rate in 2021 was likely affected by the 3.5 percent decline in the City’s overall population between 2020 and 2021 (from about 8.8 million people to 8.5 million).5 The following sections consider the variation in these rates in an attempt to more fully understand the complexities of the City’s labor force.
Understanding the Dynamics of the City’s Labor Force
Even as concerns over public health have subsided somewhat, the pandemic has raised many questions as to whether factors such as access to reliable childcare and preferences for remote work have influenced the labor force participation of certain groups. While nationally recognized trends, including a decline in the female labor force and in employment in low-wage sectors, do apply to New York City, the underlying demographic and socioeconomic dimensions of these and other trends merit further discussion.
To illuminate the specific dynamics in the City, this report uses the U.S. Bureau of Labor Statistics’ Current Population Survey over the period 2019 to 2021.6 The following sections address questions about the City’s labor force and aim to shed light on why the employment situation in the City continues to lag behind the rest of the State and the nation (see Appendix A for relevant data for the rest of the State and the nation).
How did female and male labor force participation during the pandemic compare to the past?
The female labor force participation rate has historically lagged behind the male rate in the nation and in the City. Scholars attribute this gender gap to women’s traditional family roles, as well as individual choices.7 In 2019, nationwide 57.8 percent of females participated in the labor force compared to 69.4 percent of males. In the City, this difference was more pronounced, showing a gender gap of 14.8 points compared to 11.6 points in the nation (see Figure 6).
FIGURE 6 – Unemployment and Labor Force Participation Rates by Gender in New York City, 2019 to 2021
| Unemployment | Labor Force Participation | |||||||
|---|---|---|---|---|---|---|---|---|
| Year | Total | Female | Male | Gender Gap | Total | Female | Male | Gender Gap |
| 2019 | 4.1% | 3.8% | 4.2% | 0.4 | 60.4% | 53.5% | 68.3% | 14.8 |
| 2020 | 12.5% | 12.5% | 12.4% | 0.1 | 58.8% | 52.6% | 65.8% | 13.2 |
| 2021 | 9.8% | 9.5% | 10.2% | 0.7 | 59.7% | 54.5% | 65.5% | 11.0 |
| Difference, 2019 to 2021 | 5.7 | 5.7 | 6.0 | -0.7 | 1.0 | -2.8 | ||
Note: The total unemployment and labor force participation rates noted here do not use the U.S. Bureau of Labor Statistics’ Local Area Unemployment Statistics. Instead, they use annualized monthly data from the Current Population Survey for comparability with demographic data. Gaps and differences refer to percentage points.
Sources: U.S. Bureau of Labor Statistics, Current Population Survey; OSC analysis
This gap narrowed over the course of the pandemic. In the City, the labor force participation rate for males declined more than for females between 2019 and 2020 (2.5 points versus only 0.9 points), and male workers drove the drop in overall labor force participation that year. In 2021, male participation declined further to 65.5 percent, its lowest level in 20 years, while female participation surpassed 2019 levels.
While the labor force participation rate for females has rebounded to pre-pandemic levels, the unemployment rate remains elevated. Prior to the pandemic, the female unemployment rate was lower than the male rate in the City. However, in 2020, the female unemployment rate increased by 8.7 points. This spike could be due to female workers’ significant presence in industries such as health care and social assistance (77.0 percent), and public administration (49.2 percent).8 The increase in the female unemployment rate in the City was much larger than the 4.7 point increase in the nation, where the overall share of female workers in these industries is smaller.9
In 2020, the male unemployment rate saw a smaller increase than the female rate, as male workers are more likely to be employed in industries that allowed flexible work arrangements amid the pandemic such as professional and business services (54.5 percent) and financial activities (59.0 percent). These industries employ significant numbers of workers in STEM (science, technology, engineering and math) fields.
Over the last couple decades, educators and policy makers have emphasized bridging what is called the STEM gap, as male workers tend to be more represented in related occupations, such as chemist, information technologist or financial analyst, than female workers. The Enacted Budget for State Fiscal Year (SFY) 2021-22 directed the Urban Development Corporation (UDC) to conduct a study to understand the amount of financial and technical assistance required to encourage women and minority individuals to pursue careers in STEM fields and help bridge the STEM gap. The UDC and the NYS Department of Labor are required to submit a report with findings no later than December 31, 2022.10 Dissecting these trends by race and ethnicity reveals further disparities. In fact, prior to the pandemic, Hispanic or Latino and Asian female workers experienced higher unemployment rates than their male counterparts in the City, contrary to the overall trend. In 2020, Hispanic and Asian male workers experienced a much larger rise in unemployment than their female counterparts, also contrary to the overall trend.
By 2021, male and female workers of all racial and ethnic groups in New York City experienced a decline in unemployment from 2020, except Black or African American male workers. In 2021, only 57.2 percent of Black men participated in the labor force, compared to 65.5 percent for men overall. The Black male unemployment rate had not only ticked up in the two years prior to and during the pandemic but continued to rise through 2021. However, in the nation overall, African American male workers experienced a decline in unemployment, like all other groups.
How did the presence of children in households affect labor force participation before and during the pandemic?
While family obligations have historically influenced labor market outcomes, the pandemic placed an outsized strain on parents of school-age children, particularly young children. At the height of the pandemic, the reliance on remote schooling affected parents’ ability to work as they shouldered the new responsibility of coaching and supporting their children with online learning. Parents of children below the age of five struggled more than parents of older children, as childcare center closures made it difficult to provide care and work at the same time.11
At the national level, labor force participation in 2020 for male and female workers with children each dropped by over a point amid the pandemic’s unusual working conditions. In the City, male and female workers with children fared much worse, dropping by nearly six and two points, respectively (see Figure 7). While in the nation, male and female workers with children fared similarly, in the City, female workers with children were more likely to seek work or remain employed than their male counterparts, as they experienced less severe drops in labor force participation in 2020.
FIGURE 7 – Unemployment and Labor Force Participation Rates by Gender and Presence of Children in New York City, 2019 to 2021
| Unemployment | Labor Force Participation | |||||||||
|---|---|---|---|---|---|---|---|---|---|---|
| Year | Total | Male Without Children | Male With Children | Female Without Children | Female With Children | Total | Male Without Children | Male With Children | Female Without Children | Female With Children |
| 2019 | 4.1% | 4.9% | 2.4% | 3.7% | 4.2% | 60.4% | 61.0% | 91.7% | 50.0% | 62.3% |
| 2020 | 12.5% | 11.9% | 13.1% | 12.1% | 12.6% | 58.8% | 59.0% | 86.0% | 49.2% | 60.5% |
| 2021 | 9.8% | 10.3% | 10.1% | 10.0% | 7.9% | 59.7% | 59.0% | 87.5% | 51.2% | 64.0% |
| Difference, 2019 to 2021 | 5.7 | 5.4 | 7.7 | 6.3 | 3.7 | -0.7 | -2.0 | -4.2 | 1.2 | 1.7 |
Notes: The total unemployment and labor force participation rates noted here do not use the U.S. Bureau of Labor Statistics’ Local Area Unemployment Statistics. Instead, they use annualized monthly data from the Current Population Survey for comparability with demographic data. Additionally, the rates reflect parents of own children <18 years of age. Differences refer to percentage points.
Sources: U.S. Bureau of Labor Statistics, Current Population Survey; OSC analysis
Labor force participation rose for male and female workers with children in 2021, coinciding with the full and consistent reopening of schools in the City. The labor force participation rate for female workers with children surpassed its pre-pandemic level in the City, but not in the nation, in 2021. This difference may be explained, in part, by marital status. Over the last five years, married mothers have been less likely to participate in the labor force than mothers with other marital statuses (i.e., widowed, divorced, separated, never married).12 In 2021, in the City, less than 66 percent of women with children in the labor force were married, whereas in the nation, it was over 68 percent.13
While the labor force participation rate for female workers with children has rebounded, the rate for male workers with children is still far below the pre-pandemic level, suggesting that some left the workforce in the recovery period following the onset of the pandemic. There could be many reasons for this. It is possible that family roles in the City changed, at least temporarily, as the economy reopened when COVID-19 vaccines became available and employers began requiring workers to return to the office. At the height of the pandemic, some workplaces offered flexible policies to enable workers to care for their children and aid their partners while managing their work at the same time. Return-to-work policies may have adversely affected this dynamic.14
Interestingly, among the people surveyed who said they had worked fewer than 35 hours over the last week, those citing as reasons “vacation/personal day,” “own illness/injury/medical appointment,” “childcare problems” or “other family/personal obligations” all rose between 2020 and 2021.15
Childcare problems affecting parents’ work lives surfaced in other surveys as well. For example, based on the U.S. Census Bureau’s Household Pulse Survey, over 109,000 people in the New York metropolitan area left their job to care for a child because of childcare being closed or unavailable in the month of July 2021.16 As of the middle of January 2022, nearly 80,000 people reported leaving their job in the last four weeks, a considerably higher number than the weekly average recorded between July 2021 and January 2022. These separations from work coincide with the beginning and end of the federal Child Tax Credit authorized by the American Rescue Plan Act. The credit benefited an average 21 percent of households (1.2 million) in the metropolitan area.
The SFY 2022-23 Enacted Budget includes $7 billion in support for childcare over four years.17 The budget expands the income eligibility threshold for childcare subsidies to 300 percent of the federal poverty level in an attempt to provide parents with the childcare support necessary to pursue an education or join or remain in the workforce. Additionally, the State Budget included a request from the City to enable it to offer a refundable City tax credit for businesses that provide new childcare seats for employees and a local property tax abatement for property owners undertaking retrofits to establish childcare centers. The cost of each proposal will start beginning in City Fiscal Year (FY) 2024 at $25 million per year.
How did the pandemic affect college-educated workers compared to their non-college-educated counterparts?
Amid the pandemic, stay-at-home orders forced nonessential employees to change their approach to work. Workers’ ability to adjust accordingly depended heavily on their levels of education, where college-educated workers (those with at least an associate’s degree) had more opportunities to telework or to work in a low-contact setting with low risk of exposure to COVID-19 than non-college-educated workers.18
In general, college-educated workers have experienced lower rates of unemployment than those without a college degree. After the Great Recession, the gap in unemployment rates between the groups in the City widened considerably, peaking in 2013, when those with a college degree faced an unemployment rate of 5.4 percent compared to 10.4 percent for those without one.
In the wake of the pandemic, the education gap in unemployment widened further, as industries that do not require a college degree were hit the hardest. The majority of non-college-educated workers are employed in industries that are more prone to contact with COVID-19 like construction (75.5 percent of industry employees aged 25 and over are not college educated), transportation and warehousing (70.2 percent), leisure and hospitality (60.8 percent) and retail trade (57.1 percent). Together, these industries had an average salary of $57,700 in 2020.
Most college-educated workers in the City, on the other hand, are employed in industries that have allowed remote work, such as information (82.4 percent of industry employees aged 25 and over are college educated), financial activities (71.8 percent) and professional and business services (70.6 percent).19 These industries also tend to pay more than others, as together, they had an average salary of $183,800 in 2020.20
While the unemployment rate of workers without a college degree recovered more than for workers with a college degree between 2020 and 2021 (3.6 points compared to 2.2 points), the education gap between the two groups is much higher than before the pandemic (see Figure 8). The high level of unemployment may partly explain why the labor force participation rate for workers without a college degree has not recovered to pre-pandemic levels. This group may also be facing a more difficult job market than college graduates and decide to remain out of the workforce for longer.
FIGURE 8 – Unemployment and Labor Force Participation Rates by Level of Education in New York City, 2019 to 2021
| Unemployment | Labor Force Participation | |||||||
|---|---|---|---|---|---|---|---|---|
| Year | Total | No College Degree | College Degree | Education Gap | Total | No College Degree | College Degree | Education Gap |
| 2019 | 4.1% | 5.1% | 2.3% | 2.8 | 60.4% | 51.3% | 75.1% | 23.7 |
| 2020 | 12.5% | 16.5% | 8.4% | 8.1 | 58.8% | 49.4% | 72.9% | 23.5 |
| 2021 | 9.8% | 12.9% | 6.2% | 6.7 | 59.7% | 49.4% | 74.1% | 24.7 |
| Difference, 2019 to 2021 | 5.7 | 7.8 | 4.0 | -0.7 | -2.0 | -1.0 | ||
Notes: The total unemployment and labor force participation rates noted here do not use the U.S. Bureau of Labor Statistics’ Local Area Unemployment Statistics. Instead, they use annualized monthly data from the Current Population Survey for comparability with demographic data. Gaps and differences refer to percentage points. College degree rates include workers aged 25 and older with at least an associate’s degree.
Sources: U.S. Bureau of Labor Statistics, Current Population Survey; OSC analysis
The near recovery in labor force participation of the college-educated group was driven by increased participation among Black or African American workers. This group recovered its pre-pandemic labor force participation rate in 2021. Hispanic or Latino and White workers with a college degree each remain about one point away. Among workers without a college degree, Asian-American workers have more than recovered their pre-pandemic labor force participation rate, and Hispanic workers are less than a point away.
Across education levels, Black workers continue to experience the highest rates of unemployment. In 2020, the gap in unemployment rate between African American college-educated workers (10 percent) and non-college-educated workers (14.9 percent) narrowed. However, the gap narrowed due to a larger year-over-year rise in unemployment for Black workers with a college degree (an increase of 6.6 points) than for those without (an increase of 5 points), not due to improving unemployment among Black or African American workers without a college degree. All other racial and ethnic groups experienced the opposite trend. This could be because greater shares of college-educated Black or African American workers are employed in industries such as educational services (14.2 percent of the group) and public administration (9.0 percent) than their non-college-educated counterparts (3.6 percent of the group and 5.0 percent, respectively).
New York State has recognized that for many students, part-time employment, along with family obligations, makes it challenging to pursue full-time higher education.21 Therefore, the SFY 2022-23 Enacted Budget includes $150 million to expand the Part-time Tuition Assistance Program to support part-time students in degree-seeking programs and non-degree training programs at community colleges. It also includes more than $500 million in operating support (i.e., new systems) for the State University of New York and the City University of New York. The City Council Speaker also announced a $23 million plan to support the 700,000 New Yorkers who have some CUNY credits but no degree in completing their degrees, and to provide advancement opportunities.22
Were young workers affected more by the pandemic than other age groups?
Over the last 20 years, young workers (those aged 16 to 24) have experienced much higher levels of unemployment than other age groups. For example, in 2015, the average unemployment rate for young workers was over four times higher (17.5 percent compared to 4.3 percent) than for prime-age workers (those aged 25 to 54). Young workers still had the highest unemployment rate by age group in 2019 (see Figure 9).
FIGURE 9 – Unemployment and Labor Force Participation Rates by Age Group in New York City, 2019 to 2021
| Unemployment | Labor Force Participation | ||||||||||
|---|---|---|---|---|---|---|---|---|---|---|---|
| Year | Total | 16-24 | 25-54 | 55-64 | 65+ | Total | 16-24 | 25-54 | 55-64 | 65+ | |
| 2019 | 4.1% | 9.6% | 3.5% | 3.5% | 2.6% | 60.4% | 44.4% | 79.2% | 63.8% | 20.1% | |
| 2020 | 12.5% | 20.4% | 11.6% | 12.9% | 9.1% | 58.8% | 40.4% | 77.9% | 62.1% | 18.9% | |
| 2021 | 9.8% | 20.9% | 8.8% | 8.7% | 6.9% | 59.7% | 41.6% | 78.9% | 62.0% | 19.8% | |
| Difference, 2019 to 2021 | 5.7 | 11.3 | 5.3 | 5.2 | 4.4 | -0.7 | -2.8 | -0.3 | -1.8 | -0.3 | |
Note: The total unemployment and labor force participation rates noted here do not use the U.S. Bureau of Labor Statistics’ Local Area Unemployment Statistics. Instead, they use annualized monthly data from the Current Population Survey for comparability with demographic data. Differences refer to percentage points and are subject to rounding.
Sources: U.S. Bureau of Labor Statistics, Current Population Survey; OSC analysis
Young workers tend to be even worse off in periods of economic downturn due, in part, to their lack of experience, which makes them more likely to face long-term unemployment than older, more experienced workers.23 A lack of experience means that young workers also have fewer job options and, as a result, are more prone to work in industries with lower skill requirements.24 At the onset of the pandemic, young workers were affected the most due to the fact that over 21 percent of those aged 16 to 24 in the City worked in the hard-hit leisure and hospitality industry and about 18 percent worked in the retail industry (see Figure 10).
FIGURE 10 – Share of Workers Aged 16 to 24 in Major Industries in New York City, 2019
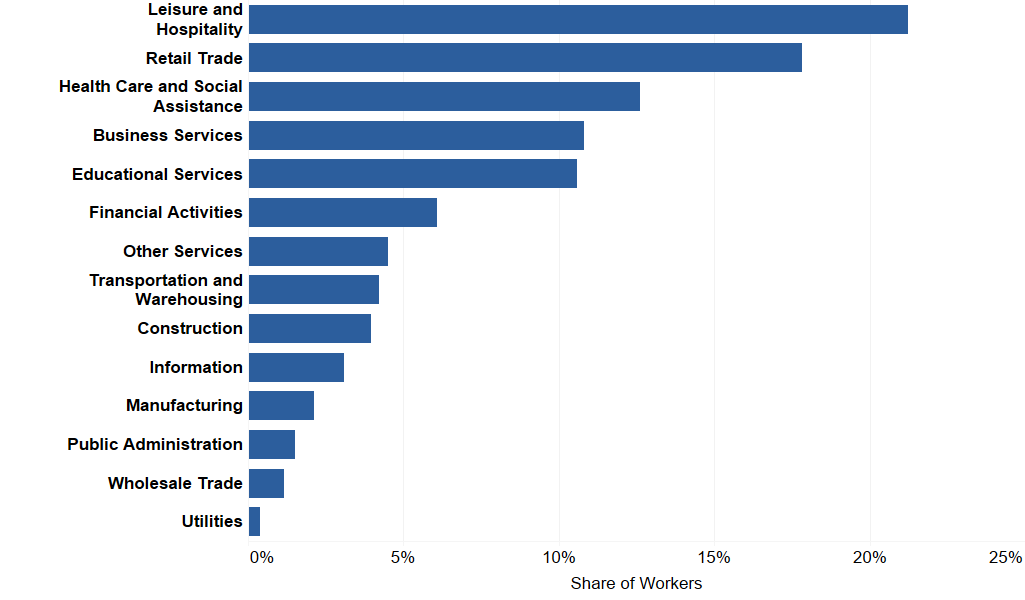
Sources: U.S. Census Bureau, 2019 American Community Survey 1-year estimates; OSC analysis
In 2021, young workers in the City were the only age group to see their unemployment rate rise higher than in 2020. This trend was very different from the nation, where young workers experienced a decline in unemployment similar to other age groups. This difference may be explained by job openings. As of the end of 2021, nationwide, job openings in the leisure and hospitality industry, for example, were closer to pre-pandemic levels than in the City.25 More openings generally indicate a greater demand for too few workers (i.e., tight labor market). These trends suggest it was less difficult to find work in the nation than in the City.
Leisure and hospitality businesses in the City are dominated by Hispanic or Latino workers (35.1 percent). Young Hispanic workers are the only group of young workers to have regained their pre-pandemic labor force participation rates, whereas young workers from other racial and ethnic groups have not. Young Hispanic workers were also the only group of young workers to experience a decline in unemployment in 2021 from 2020, meaning that all other racial and ethnic groups drove the overall rise in unemployment experienced by young workers.
Among other racial and ethnic groups, young Black or African American workers saw the largest point increase in unemployment in 2021. Among the City’s Black labor force (of all ages), nearly 37 percent work in the educational services and health care and social assistance industries, which may be a contributor to this trend. As the summer approaches, job openings in these industries and others will likely increase, especially as internships provide an essential talent pipeline for employers.
As part of his Blueprint to End Gun Violence, the Mayor recently announced 90,000 summer employment opportunities for young workers through the Summer Youth Employment Program.26 This is the most jobs made available in the program’s history and is intended to provide participants with paid opportunities to explore possible career interests. Among potential participants, those in foster care tend to have the greatest difficulties finding employment. To provide professional opportunities to those workers, the City also announced a new vocational and training program called V-CRED.27 In partnership with university and corporate employers, the City aims to provide training for professional certification along with paid internships and apprenticeships focused in the information, construction and health care industries.
How did the nature of work over the pandemic affect labor outcomes for people with disabilities?
The pandemic introduced new challenges and opportunities for groups that have historically faced barriers to employment, including people with disabilities. People with disabilities represented roughly 12 percent of the population nationally and about 10 percent in the City in 2021.
Prior to 2019, a growing number of people with disabilities joined the labor force in the City, reaching 14.6 percent in 2018. However, in 2019, this figure declined to 12.7 percent (see Figure 11). Amid the pandemic, however, the labor force participation rate for people with disabilities rose to its highest level over the last decade. This improvement could be due to a broader shift toward remote work, which made previously inaccessible jobs possible for workers with mobility challenges.28
FIGURE 11 – Unemployment and Labor Force Participation Rates by Disability Status in New York City, 2019 to 2021
| Unemployment | Labor Force Participation | |||||||
|---|---|---|---|---|---|---|---|---|
| Year | Total | With Disability | Without Disability | Disability Gap | Total | With Disability | Without Disability | Disability Gap |
| 2019 | 4.1% | 8.6% | 4.0% | 4.7 | 60.4% | 12.7% | 65.6% | 52.9 |
| 2020 | 12.5% | 13.3% | 12.5% | 0.8 | 58.8% | 14.2% | 63.5% | 49.3 |
| 2021 | 9.8% | 17.0% | 9.6% | 7.4 | 59.7% | 17.5% | 64.1% | 46.6 |
| Difference, 2019 to 2021 | 5.7 | 8.4 | 5.7 | -0.7 | 4.8 | -1.5 | ||
Notes: The total unemployment and labor force participation rates noted here do not use the U.S. Bureau of Labor Statistics’ Local Area Unemployment Statistics. Instead, they use annualized monthly data from the Current Population Survey for comparability with demographic data. Gaps and differences refer to percentage points.
Sources: U.S. Bureau of Labor Statistics, Current Population Survey; OSC analysis
The trend in the City was very different from that in the rest of the State. Though the labor force participation rate of people with disabilities in the rest of the State was higher than in the City in 2019 (21.6 percent compared to only 12.7 percent), it had fallen below the rate in the City by 2021 (16.8 percent compared to 17.5 percent).
In 2021, people with disabilities in the City made up 3 percent of the labor force compared to only 2 percent in 2019. At the same time, even as total unemployment has improved since the onset of the pandemic, unemployment continued to rise for people with disabilities in 2021. As a result, their unemployment rate almost doubled from 2019 to 2021, and the disability gap in unemployment grew.
One reason for this surge could be that more people with disabilities were looking for work and were, therefore, unemployed in 2021 than in 2020, contrary to the experience of people without disabilities. In the nation, however, the unemployment rate of people with disabilities fell in 2021. This difference may be explained by age. In the City, people with disabilities aged 65 and over comprised 58.4 percent of all people with disabilities. In the nation, they comprised only 49.9 percent in 2021. This suggests there could be a larger share of elderly people with disabilities looking for work in the City than in the nation.29
One barrier that has been particularly challenging is the inaccessibility of transit systems to people with disabilities.30 In October 2021, the City, in collaboration with the Metropolitan Transportation Authority, adopted zoning rules to advance transit accessibility, as only one-third of its train stations are accessible for people with disabilities. In order to enhance employment opportunities for people with disabilities, there is a need for more accessible and disability-friendly work environments nationally.31
How did the pandemic affect the labor force participation of noncitizen immigrants and citizens?
The City has historically housed a much larger share of noncitizen immigrants than the rest of the State and the nation. In 2019, the noncitizen immigrant group made up 19.1 percent of the working-age population in the City, compared to 5.9 percent in the rest of the State and 8.1 percent of the nation. Due to the travel restrictions faced by noncitizens during the pandemic, the working-age population of noncitizen immigrants declined in the nation, and particularly in the City. From 2019 to 2021, the noncitizen immigrant share of the working-age population in the City dropped over 2 points to 17.0 percent, the lowest level in the 20 years before the pandemic. The share in the nation also fell but less dramatically by 0.2 points to 7.8 percent.
As noncitizen immigrants tend to face barriers to residing in the country legally, they typically rely on having an employer-sponsored visa. Therefore, the labor force participation rate among noncitizens tends to be much higher than that of citizens (which include both foreign-born and native-born people). However, the pandemic presented greater challenges for the noncitizen immigrant population than for the citizen population (e.g., travel restrictions prohibiting entry into the country), leading to a larger decline in labor force participation among noncitizens in the City than total workers between 2019 and 2021 (see Figure 12). In the rest of the State and the nation, labor force participation among citizens declined more sharply than that of noncitizens.
FIGURE 12 – Unemployment and Labor Force Participation Rates in New York City by Citizenship Status, 2019 to 2021
| Unemployment | Labor Force Participation | |||||||
|---|---|---|---|---|---|---|---|---|
| Year | Total | Noncitizen | Citizen | Citizenship Gap | Total | Noncitizen | Citizen | Citizenship Gap |
| 2019 | 4.1% | 3.5% | 4.2% | 0.7 | 60.4% | 63.7% | 59.6% | 4.1 |
| 2020 | 12.5% | 13.4% | 12.3% | 1.1 | 58.8% | 63.0% | 57.9% | 5.1 |
| 2021 | 9.8% | 9.9% | 9.8% | 0.1 | 59.7% | 62.1% | 59.1% | 3.0 |
| Difference, 2019 to 2021 | 5.7 | 6.4 | 5.6 | -0.7 | -1.6 | -0.5 | ||
Notes: The total unemployment and labor force participation rates noted here do not use the U.S. Bureau of Labor Statistics’ Local Area Unemployment Statistics. Instead, they use annualized monthly data from the Current Population Survey for comparability with demographic data. Gaps and differences refer to percentage points.
Sources: U.S. Bureau of Labor Statistics, Current Population Survey; OSC analysis
Legal barriers to acquiring work, including limited visas, lack of recognition of foreign credentials, and low English proficiency, led to a higher unemployment rate among noncitizen immigrants than among citizens nationwide amid the pandemic.32 In the City, the unemployment rate rose more for noncitizens than for citizens from 2019 to 2021, leaving noncitizens with an unemployment rate of 9.9 percent in 2021, their highest rate since the Great Recession.
At the onset of the pandemic, many noncitizen immigrants in the City were shut out of government programs created for those in need, according to the Center for an Urban Future.33 In response, the State created the $2 billion Excluded Workers Fund in 2021 to provide financial relief for workers who were ineligible for other programs, and those funds have now been exhausted.34 Other policies to reduce legal barriers to work and to provide legal services for the noncitizen population continue to be discussed in the City.
How have trends in self-employment changed over time?
Roughly 1 in 10 of the nation’s workers identified as self-employed in 2021. Self-employment among workers in the City was on an upward trajectory leading into the pandemic, after recovering from a dip in 2010 following the Great Recession (see Figure 13).35
FIGURE 13 – Self-Employed Workers as a Share of Total Workers in New York City, 2000 to 2021
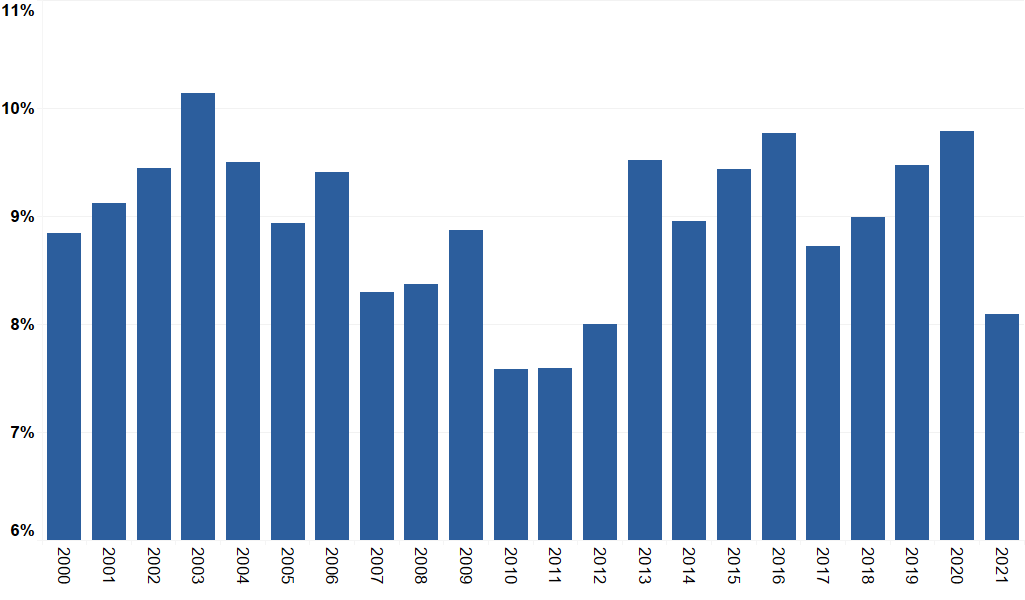
Note: Total workers include federal, State and local government, for profit and nonprofit private, and incorporated and unincorporated self-employment.
Sources: U.S. Bureau of Labor Statistics, Current Population Survey; OSC analysis
The self-employment trend in the City was different from those in the rest of the State and the nation. Prior to the pandemic, the percentage of self-employed workers in the City (9.5 percent) exceeded the rest of the State (8.5 percent) and was close to the national share of 9.8 percent. However, after self-employment rose in 2020, as was the case during the last two recessions, the City experienced a sharp decline in self-employment, and ultimately declined 1.4 points from 2019 to 2021. In comparison, the rest of the State saw a gain of 2.3 points and the nation saw a gain of 0.5 points. As a result, the percentage of self-employed workers in the City (8.1 percent) is now lower than in the rest of the State (10.8 percent) and the nation (10.4 percent).
In the City, where the share of female self-employed workers has been less than the male share since at least 2000, it declined more between 2019 and 2021 than it did for their male counterparts. In 2021, the share of male workers who were self-employed was 9.8 percent compared to 6.2 percent for female workers; the latter is the lowest figure since 2010.
Breaking out self-employment by race and ethnicity, all groups experienced growth from 2019 to 2020 except Asian workers, who experienced a decline of 0.8 points (see Figure 14). Similar trends were seen in the rest of the State and the nation. The decline coincides with a rise in anti-Asian sentiment amid the pandemic. In 2021, however, aside from Asian workers, all racial and ethnic groups experienced large declines that offset the increases in 2020.
FIGURE 14 – Self-Employed Workers as a Share of Total Workers by Race and Ethnicity in New York City, 2019 to 2021
| Year | White | Black | Asian | Hispanic |
|---|---|---|---|---|
| 2019 | 12.9% | 6.1% | 8.0 % | 8.0% |
| 2020 | 13.1% | 6.4% | 7.2 % | 9.2% |
| 2021 | 10.6% | 5.7% | 6.8 % | 7.1% |
| Difference, 2019 to 2021 | -2.3 | -0.4 | -1.2 | -0.9 |
Note: Differences refer to percentage points.
Sources: U.S. Bureau of Labor Statistics, Current Population Survey; OSC analysis
To understand why self-employment declined in 2021, it is important to look at the types of self-employment, incorporated and unincorporated. The incorporated group includes people who work for themselves in a corporate structure (i.e., those who incorporated their businesses for reasons including tax benefits and opportunities for external funding) while the unincorporated group includes those who work for themselves in other legal but less formal enterprises (i.e., gig workers). Incorporated self-employment in the City was generally on the rise leading into the pandemic and was the main driver of the recovery in self-employment following the Great Recession, reaching 35.7 percent of the City’s self-employed workforce in 2019.
However, in 2020, unincorporated self-employment drove the increase in overall self-employment. While the incorporated group’s share of self-employment shrank to 33.2 percent, the unincorporated group’s share grew by 2.5 points to 66.8 percent. This increase is consistent with the findings that business formations increased over 2020, particularly among online microbusinesses (those with fewer than 10 employees), as poor employment conditions pushed workers to form their own businesses.36
However, in 2021, the unincorporated group lost the gains from 2020, and then some, while the incorporated group continued to decline in size. In contrast, the rest of the State experienced increases to both incorporated and unincorporated self-employment between 2019 and 2021. Like the rest of the State, the nation saw increases in unincorporated self-employment, particularly among Black or African American and Hispanic or Latino workers.
The decrease in self-employment in the City relative to the increases seen in the rest of the State and the nation could be explained by anecdotal evidence showing that some new business owners left costly and densely populated urban areas to conduct business in areas with lower costs of living.37 As part of the Mayor’s Blueprint for NYC’s Economic Recovery, the City aims to support small businesses and entrepreneurship.38 The City plans to streamline business inspections and reform licensing requirements, as well as launch a Small Business Opportunity Fund to support historically underserved local businesses and entrepreneurs.
As female self-employment lags behind male self-employment, the City also plans to expand its Minority- and Women-Owned Business Enterprise (MWBE) program by increasing the number and size of City contracts going to these firms. At the State level, the SFY 2022-23 Enacted Budget includes a new initiative that will provide flexible grants to support early-stage microbusinesses (i.e., businesses with fewer than 10 employees) and small businesses, following the implementation of the State’s Pandemic Small Business Recovery program, which offered $800 million in funding for small businesses in the State. The Mayor also signed an executive order to reform existing business regulations for small businesses by reducing fine schedules and allowing warnings for first-time violations.39
Outlook
While the national news has reported on many of the labor force participation trends discussed above, which have also been experienced in the City, local trends have not followed in every instance. For example, nationally, women with children were hit hard amid the pandemic due, in part, to lack of access to childcare. The findings in this report for New York City mothers coincide with these national trends as women with children suffered a significant rise in unemployment in the first year of the pandemic. However, unlike in other places throughout the nation, women with children in the City made a remarkable recovery one year later compared to men with children.
Variation observed between the City and the nation is due, in part, to male-female differences in economic sectors of employment. In fact, some of the differences discussed above related to education and age are rooted in how severely an economic sector was hit by the COVID-19 pandemic, which has implications for the recovery of certain racial and ethnic groups that tend to be employed in these sectors. Other dissimilarities related to disability status and citizenship status are based in structural and legal barriers that have made it difficult for the groups to acquire work.
The City and the State are making efforts to support the labor force, both in terms of making it easier to seek work and improving employment outcomes, with some policies that target the groups discussed in this report. In particular, programs have been created to help young workers, caretakers and small businesses, with the allocation of funding and other types of support. Efforts to aid tourism drivers have also been made, including tax credits for theatrical and musical productions and smaller restaurants and grant programs for venues, as well as hiring grants for hotels, performing arts companies, museums, and scenic tour operators and other tourism-dependent businesses.
Especially for young workers, who saw their unemployment rate continue to rise in 2021, the City is looking to bolster employment opportunities and enhance the talent pool to keep the City’s labor force economically competitive. For other groups, such as people with disabilities, who also saw their unemployment rate continue to rise in 2021, more can be done to ensure they find safe and reliable work. A slow return in noncitizen immigrants to the labor force, especially as the pandemic has impacted mobility and noncitizens immigrants continued to leave the labor force in 2021, could also contribute to the City’s overall labor force participation rates remaining lower in the near term.
While this report discusses some of the reasons for New York City’s uneven recovery when compared to the rest of New York State and the nation, it cannot discuss all of them, as the dynamics discussed above intersect in complex ways. Rather, the report provides a set of questions for a more holistic conversation about the City’s labor force that addresses the demographic and socioeconomic makeup of the labor force. In order to realize a full economic recovery, City and State officials must continue to ask the type of questions posed above and scrutinize whether existing policies are reaching and supporting the success of struggling communities. Doing so will provide the City, the State, educational institutions and the business community with the data necessary to make informed decisions that will enable the City to realize its full potential for an equitable and sustainable recovery.
Appendix A
FIGURE A.1 – Unemployment and Labor Force Participation Rates for the Rest of New York State by Demographic Group, 2019 to 2021
| Unemployment | Labor Force Participation | |||||||
|---|---|---|---|---|---|---|---|---|
| 2019 | 2020 | 2021 | Difference, 2019 to 2021 | 2019 | 2020 | 2021 | Difference, 2019 to 2021 | |
| Total | 3.8% | 8.3% | 5.2% | 1.4 | 61.1% | 60.0% | 59.1% | -2.0 |
| Gender | ||||||||
| Male | 4.3% | 8.7% | 5.3% | 1.1 | 65.7% | 64.6% | 64.9% | -0.8 |
| Female | 3.6% | 7.9% | 5.1% | 1.5 | 56.8% | 55.6% | 53.8% | -3.0 |
| Presence of Children | ||||||||
| Male Without Children | 5.0% | 9.9% | 5.8% | 0.8 | 58.0% | 56.4% | 57.3% | -0.6 |
| Male With Children | 2.7% | 6.2% | 4.5% | 1.8 | 92.2% | 92.8% | 93.4% | 1.3 |
| Female Without Children | 3.7% | 8.0% | 4.9% | 1.2 | 51.1% | 49.8% | 47.9% | -3.1 |
| Female With Children | 3.4% | 7.6% | 5.8% | 2.4 | 73.8% | 72.9% | 73.6% | -0.2 |
| Education | ||||||||
| No College Degree | 3.8% | 9.9% | 6.6% | 2.8 | 53.7% | 52.6% | 52.7% | -1.0 |
| College Degree | 2.5% | 5.5% | 3.3% | 0.7 | 71.4% | 69.9% | 68.5% | -3.0 |
| Race/Ethnicity | ||||||||
| White | 3.8% | 7.7% | 4.2% | 0.5 | 60.2% | 59.0% | 57.2% | -3.0 |
| Black | 5.1% | 8.5% | 6.4% | 1.3 | 60.4% | 57.2% | 58.7% | -1.7 |
| Asian | 2.7% | 8.3% | 6.4% | 3.7 | 60.4% | 57.2% | 63.0% | 2.7 |
| Hispanic | 5.2% | 12.3% | 8.2% | 3.1 | 68.2% | 70.8% | 69.8% | 1.7 |
| Age | ||||||||
| 16-24 | 10.5% | 15.3% | 9.1% | -1.5 | 51.4% | 51.1% | 49.1% | -2.4 |
| 25-54 | 3.3% | 7.3% | 4.8% | 1.5 | 82.1% | 81.6% | 82.3% | 0.1 |
| 55-64 | 2.1% | 7.7% | 4.3% | 2.1 | 64.9% | 66.2% | 64.9% | 0.0 |
| 65+ | 3.7% | 6.7% | 4.0% | 0.3 | 22.0% | 19.4% | 18.9% | -3.1 |
| Disability | ||||||||
| With Disability | 7.8% | 14.5% | 11.3% | 3.4 | 21.6% | 19.3% | 16.8% | -4.7 |
| Without Disability | 3.8% | 8.1% | 5.0% | 1.2 | 66.5% | 65.0% | 64.6% | -1.8 |
| Citizenship | ||||||||
| Citizens | 4.0% | 8.2% | 5.1% | 1.2 | 60.7% | 59.5% | 58.7% | -2.0 |
| Noncitizens | 4.2% | 9.4% | 7.1% | 3.0 | 67.9% | 66.4% | 67.6% | -0.3 |
Note: Differences refer to percentage points and are subject to rounding.
Sources: U.S. Bureau of Labor Statistics, Local Area Unemployment Statistics; U.S. Bureau of Labor Statistics, Current Population Survey; OSC analysis
FIGURE A.2 – Unemployment and Labor Force Participation Rates for the Nation by Demographic Group, 2019 to 2021
| Unemployment | Labor Force Participation | ||||||||
|---|---|---|---|---|---|---|---|---|---|
| 2019 | 2020 | 2021 | Difference, 2019 to 2021 | 2019 | 2020 | 2021 | Difference, 2019 to 2021 | ||
| Total | 3.7% | 8.1% | 5.4% | 1.7 | 63.4% | 62.0% | 61.8% | -1.6 | |
| Gender | |||||||||
| Male | 3.8% | 7.8% | 5.5% | 1.8 | 69.4% | 67.8% | 67.7% | -1.7 | |
| Female | 3.7% | 8.3% | 5.3% | 1.6 | 57.8% | 56.5% | 56.2% | -1.6 | |
| Presence of Children | |||||||||
| Male Without Children | 4.4% | 8.8% | 6.2% | 1.8 | 62.3% | 60.7% | 60.7% | -1.6 | |
| Male With Children | 2.2% | 5.6% | 3.9% | 1.6 | 93.4% | 92.3% | 92.5% | -0.9 | |
| Female Without Children | 3.7% | 8.7% | 5.4% | 1.7 | 52.6% | 51.3% | 51.1% | -1.5 | |
| Female With Children | 3.6% | 7.5% | 5.1% | 1.6 | 72.6% | 71.4% | 71.3% | -1.2 | |
| Education | |||||||||
| No College Degree | 3.8% | 9.2% | 6.4% | 2.6 | 57.4% | 55.8% | 55.3% | -2.0 | |
| College Degree | 2.2% | 5.3% | 3.4% | 1.2 | 73.0% | 71.5% | 71.0% | -2.0 | |
| Race/Ethnicity | |||||||||
| White | 3.1% | 6.6% | 4.2% | 1.2 | 62.4% | 61.1% | 60.6% | -1.8 | |
| Black | 6.2% | 11.4% | 8.7% | 2.5 | 62.9% | 60.5% | 60.9% | -2.0 | |
| Asian | 2.7% | 8.5% | 5.1% | 2.4 | 63.9% | 62.8% | 63.8% | -0.1 | |
| Hispanic | 4.3% | 10.5% | 6.9% | 2.6 | 67.2% | 65.7% | 65.7% | -1.5 | |
| Age | |||||||||
| 16-24 | 8.5% | 15.2% | 9.8% | 1.3 | 56.2% | 53.7% | 55.5% | -0.7 | |
| 25-54 | 3.1% | 7.2% | 5.0% | 1.8 | 82.7% | 81.5% | 81.6% | -1.1 | |
| 55-64 | 2.6% | 6.7% | 4.2% | 1.6 | 65.7% | 65.2% | 64.9% | -0.7 | |
| 65+ | 3.0% | 7.4% | 4.4% | 1.4 | 20.7% | 19.9% | 19.2% | -1.5 | |
| Disability | |||||||||
| With Disability | 7.4% | 12.5% | 10.2% | 2.9 | 21.0% | 20.7% | 21.5% | 0.4 | |
| Without Disability | 3.6% | 7.9% | 5.2% | 1.6 | 69.0% | 67.3% | 67.2% | -1.8 | |
| Citizenship | |||||||||
| Citizens | 3.7% | 7.9% | 5.4% | 1.6 | 63.0% | 61.5% | 61.3% | -1.7 | |
| Noncitizens | 3.6% | 9.6% | 5.9% | 2.3 | 68.1% | 67.1% | 67.6% | -0.4 | |
Note: Differences refer to percentage points.
Sources: U.S. Bureau of Labor Statistics, Local Area Unemployment Statistics; U.S. Bureau of Labor Statistics, Current Population Survey; OSC analysis
Endnotes
1 New York State Department of Labor, Current Employment Statistics, and U.S. Bureau of Labor Statistics, Current Employment Statistics.
2 Office of the New York State Comptroller (OSC), New York City Industry Sector Dashboards, March 2022, at https://www.osc.state.ny.us/osdc/reports/nyc-sectors/arts-entertainment-and-recreation.
3 New York State Department of Labor, Local Area Unemployment Statistics, and U.S. Bureau of Labor Statistics, Current Population Survey.
4 New York State Department of Labor, Local Area Unemployment Statistics, and U.S. Bureau of Labor Statistics, Current Population Survey.
5 U.S. Census Bureau, Population Estimates.
6 OSC analyzed annual data aggregated from monthly files of the Current Population Survey.
7 Bureau of Labor Statistics, “Women in the Labor Force: A Databook,” U.S. Bureau of Labor Statistics, April 2021, at https://www.bls.gov/opub/reports/womens-databook/2020/home.htm#:~:text=the%20technical%20notes.)-,Selected%20demographic%20characteristics,(See%20table%202 and Elisabeth Jacobs and Kate Bahn, “Women’s History Month: U.S. Women’s Labor Force Participation,” Washington Center for Equitable Growth, March 22, 2019, at https://www.equitablegrowth.org/womens-history-month-u-s-womens-labor-force-participation/.
8 Patricia Cohen, “Recession With a Difference: Women Face Special Burden,” New York Times, November 17, 2020, at https://www.nytimes.com/2020/11/17/business/economy/women-jobs-economy-recession.html.
9 U.S. Census Bureau, 2019 American Community Survey 1-year estimates.
10 New York State Senate, Senate Bill S531B, 2021-2022 Legislative Session, at https://www.nysenate.gov/legislation/bills/2021/s531/amendment/b.
11 Emma K. Lee and Zachary Parolin, “The Care Burden During COVID-19: A National Database of Child Care Closures in the United States,” Socius: Sociological Research for a Dynamic World, 2021, at https://journals.sagepub.com/doi/pdf/10.1177/23780231211032028.
12 Bureau of Labor Statistics, “Married Mothers Less Likely to Participate in Labor Force in 2017 Than Other Moms,” U.S. Bureau of Labor Statistics, April 2018, at https://www.bls.gov/opub/ted/2018/married-mothers-less-likely-to-participate-in-labor-force-in-2017-than-other-moms.htm and Bureau of Labor Statistics, “Employment Characteristics of Families—2021,” U.S. Bureau of Labor Statistics, April 2022, at https://www.bls.gov/news.release/pdf/famee.pdf.
13 U.S. Bureau of Labor Statistics, Current Population Survey.
14 Olivia Lofton, et al., “Parents in a Pandemic Labor Market,” Federal Reserve Bank of San Francisco (FRBSF), February 4, 2021, at https://www.frbsf.org/economic-research/wp-content/uploads/sites/4/wp2021-04.pdf and Charisse Jones, “Dads Took on More Childcare When They Worked from Home During COVID-19. Will a Vaccine End That?”, USA Today, December 16, 2020, at https://www.usatoday.com/story/money/2020/12/16/coronavirus-work-from-home-dad-father-changes/5910195002/.
15 U.S. Bureau of Labor Statistics, Current Population Survey.
16 U.S. Census Bureau, Household Pulse Survey, Weeks 34 to 41.
17 New York State, Governor Hochul Announces Historic Investment in Child Care as Part of the FY 2023 Budget, April 9, 2022, at https://www.governor.ny.gov/news/governor-hochul-announces-historic-investment-child-care-part-fy-2023-budget.
18 Cody Parkinson, “COVID-19, Educational Attainment, and the Impact on American Workers,” U.S. Bureau of Labor Statistics, September 2020, at https://www.bls.gov/opub/mlr/2020/beyond-bls/covid-19-educational-attainment-and-the-impact-on-american-workers.htm#:~:text=The%20rate%20rose%205.5%20percentage,from%20February%20to%20May%202020 and Mary Daly, et al., “The Unequal Impact of COVID-19: Why Education Matters,” FRBSF Economic Letter, June 29, 2020, at https://www.frbsf.org/wp-content/uploads/sites/4/el2020-17.pdf.
19 U.S. Census Bureau, 2019 American Community Survey 1-year Public Use Microdata Sample.
20 New York State Department of Labor, Quarterly Census of Employment and Wages.
21 New York State, Governor Hochul Announces Unprecedented Support for Education in FY 2023 Budget, Including $31.5 Billion in School Aid, April 9, 2022, at https://www.governor.ny.gov/news/governor-hochul-announces-unprecedented-support-education-fy-2023-budget-including-315-billion.
22 Jeff Coltin, “City Council Speaker Adrienne Adams Wants New Yorkers to Finish Their College Degrees,” City and State New York, March 30, 2022, at https://www.cityandstateny.com/policy/2022/03/city-council-speaker-adrienne-adams-wants-new-yorkers-finish-their-college-degrees/363843/ and New York City Council, The New York City Council’s Response to the Fiscal 2023 Preliminary Budget and Fiscal 2022 Preliminary Mayor’s Management Report, April 1, 2022, at https://council.nyc.gov/budget/wp-content/uploads/sites/54/2022/04/Fiscal-2023-Preliminary-Budget-Response-.pdf.
23 Elise Gould and Melat Kassa. “Young Workers Hit Hard by the COVID-19 Economy,” Economic Policy Institute, October 14, 2020, at https://www.epi.org/publication/young-workers-covid-recession/.
24 Stephanie Aaronson and Francisca Alba, “Unemployment Among Young Workers During COVID-19,” Brookings, September 10, 2020, at https://www.brookings.edu/research/unemployment-among-young-workers-during-covid-19/.
25 Raj Chetty, et al., “Opportunity Insights Economic Tracker,” 2020, at https://tracktherecovery.org/.
26 New York City, “New York City Mayor Eric Adams Announces Record 100,000 Summer Youth Employment Opportunities,” City of New York, February 15, 2022, at https://www1.nyc.gov/office-of-the-mayor/news/081-22/new-york-city-mayor-eric-adams-record-100-000-summer-youth-employment-opportunities#/0.
27 New York City, “Mayor Adams Announces New Career Training Program for Youth in Foster Care,” City of New York, March 29, 2022, at https://www1.nyc.gov/office-of-the-mayor/news/157-22/mayor-adams-new-career-training-program-youth-foster-care#/0.
28 Josh Cunningham, “COVID-19 and Employment for People with Disabilities,” National Conference of State Legislators, March 24, 2021, at https://www.ncsl.org/research/labor-and-employment/covid-19-and-employment-for-people-with-disabilities.aspx.
29 Bureau of Labor Statistics, “Persons with a Disability: Labor Force Characteristics—2021,” February 24, 2022, at https://www.bls.gov/news.release/pdf/disabl.pdf.
30 New York City, “New York City Adopts Zoning Rules to Advance Transit Accessibility,” City of New York, October 7, 2021, at https://www1.nyc.gov/office-of-the-mayor/news/678-21/new-york-city-adopts-zoning-rules-advance-transit-accessibility.
31 Lily Roberts, et al., “COVID-19 Likely Resulted in 1.2 Million More Disabled People by the End of 2021—Workplaces and Policy Will Need to Adapt,” Center for American Progress, February 09, 2022, at https://www.americanprogress.org/article/covid-19-likely-resulted-in-1-2-million-more-disabled-people-by-the-end-of-2021-workplaces-and-policy-will-need-to-adapt/.
32 National Conference of State Legislators, “Barriers to Work: Improving Access to Licensed Occupations for Immigrants with Work Authorization,” July 17, 2018, at https://www.ncsl.org/research/labor-and-employment/barriers-to-work-immigrants-with-work-authorization.aspx.
33 Center for an Urban Future, “Under Threat and Left Out: NYC’s Immigrants and the Coronavirus Crisis,” June 2020, at https://nycfuture.org/research/under-threat-and-left-out.
34 New York State Department of Labor, “Excluded Workers Fund,” January 2022, at https://dol.ny.gov/system/files/documents/2022/01/nys-ewf-whitepaper-november21_01-26-22_0.pdf.
35 Note that self-employment numbers are prefiltered by the U.S. Bureau of Labor Statistics’ Current Population Survey to workers who are employed, meaning that OSC did not perform additional calculations to derive the self-employed labor force base from the self-employed population.
36 Jeremy Hartman and Joseph Parilla. “Microbusinesses flourished during the pandemic. Now we must tap into their full potential.” Brookings Institute, January 2, 2022, at https://www.brookings.edu/blog/the-avenue/2022/01/04/microbusinesses-flourished-during-the-pandemic-now-we-must-tap-into-their-full-potential/.
37 Ben Casselman, “Start-Up Boom in the Pandemic Is Growing Stronger,” New York Times, August 19, 2021, at https://www.nytimes.com/2021/08/19/business/startup-business-creation-pandemic.html.
38 New York City, “Mayor Adams to ‘Rebuild, Renew, Reinvent,’ Unveils Blueprint for NYC's Economic Recovery,” City of New York, March 10, 2022, at https://www1.nyc.gov/office-of-the-mayor/news/119-22/mayor-adams-rebuild-renew-reinvent-blueprint-nyc-s-economic-recovery#/0.
39 New York City, “Mayor Adams Signs ‘Small Business Forward’ Executive Order to Reform Small Business Violations,” City of New York, January 4, 2022, at https://www1.nyc.gov/office-of-the-mayor/news/002-22/mayor-adams-signs-small-business-forward-executive-order-reform-small-business-violations#/0.