

Recent Trends and Impact of COVID-19 in Brooklyn
May 2022
PDF Version Español | Kreyòl Ayisyen | 中文
Highlights
- Brooklyn has the largest population of the five boroughs with 2.7 million people in 2020 and was the fastest growing borough over the last decade (9.1 percent).
- Private sector employment in Brooklyn grew by 47.5 percent from 2010 to 2019, faster than citywide (28.7 percent).
- Leisure and hospitality sector jobs grew the fastest (by 109 percent), with nearly three-quarters occurring in restaurants and bars.
- The pandemic and public health response led Brooklyn private sector employment to decline by 19.3 percent by the second quarter of 2020, from the second quarter of 2019 level, better than the citywide rate of job loss (21.1 percent).
- Of the five boroughs, Brooklyn had the highest total COVID-19 cases, hospitalizations and deaths as of January 2022, reflecting its relative population size.
- However, Brooklyn’s cumulative COVID-19 case rate was second-lowest of the five boroughs. Cumulative hospitalization and death rates were third-lowest.
- As of the third quarter of 2021, Brooklyn had regained over 100,000 jobs from the start of re-opening, registering a faster pace of improvement than citywide.
- Brooklyn businesses received one-fifth or more of federal COVID relief loans and more than one-tenth of relief grants.
- The borough continues to be a technology and innovation center of the City, with hubs for manufacturing and technology activity.
Brooklyn (coterminous with Kings County) experienced the largest population growth among New York City’s boroughs between 2010 and 2020 and appears poised to keep growing. With an extensive transportation network, respected educational institutions, and popular entertainment and cultural amenities, Brooklyn is a magnet for new residents. In addition to a large non-immigrant population, the borough has attracted immigrants from countries like China, Jamaica, the Dominican Republic, Haiti, Ukraine, Mexico, Trinidad and Tobago and Russia, putting it in the top 10 for highest share of immigrants among the largest counties nationwide.
Population growth has supported economic gains, as employment, median incomes, and businesses all saw increases exceeding those citywide since 2010. However, there is significant variation in economic outcomes, as some neighborhoods remain well behind citywide and boroughwide levels. In addition, household and childhood poverty rates are still higher than citywide, although the gaps have narrowed.
The COVID-19 pandemic has exacerbated this inequality by devastating the City’s economy, which continues to face an uphill recovery across its sectors. Notably, the health care, retail trade, leisure and hospitality, and business services sectors (which together accounted for almost one-quarter of borough employment) had not fully recovered as of the third quarter of 2021. Even so, employment levels increased in all but two sectors since the re-opening, subway ridership levels are rising, and Brooklyn continues to develop its innovation ecosystem with the support of City and State partners. For the City to experience a full recovery, Brooklyn will have to return to its pre-pandemic economic trajectory.
Introduction
Brooklyn is the second largest in area (70.82 square miles) of the five boroughs after Queens (108.53 square miles). Many of the early settlements are now a part of well-known Brooklyn areas or neighborhoods (see Figure 1).
As the borough has grown geographically, so has its landscape, from historical brownstones to mixed use to ultra-modern, luxury buildings. Recent efforts to improve and revitalize areas of Brooklyn included a focus on building industrial parks and technology and innovation districts. As a result, Downtown Brooklyn is the City’s largest central business district outside of Manhattan.
Brooklyn has an extensive transportation network consisting of mass transit (buses, subway lines, rail lines and ferries) and roads, and is connected to the rest of New York City by four bridges (including Brooklyn Bridge), the Brooklyn Battery Tunnel and several subway tubes.
The borough is home to 20 higher education institutions, including five SUNY and CUNY locations.1 There are also well-known entertainment and cultural amenities such as the Brooklyn Academy of Music, Brooklyn Music School, Theatre for a New Audience, the Brick Theater and Kings Theatre. Barclays Center, the Coney Island Amusement Parks and the New York Aquarium are also located in Brooklyn.
FIGURE 1: Map of Brooklyn
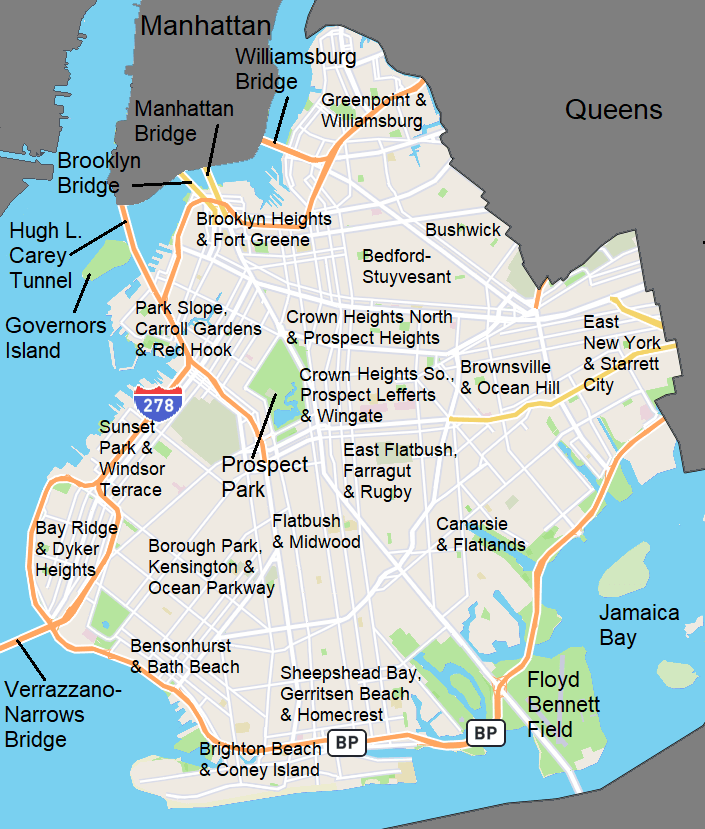
Source: OpenStreetMap
FIGURE 2: Population Growth by Borough
| Borough | Total Population 2020 | Change 2010-2020 |
|---|---|---|
| Brooklyn | 2,736,070 | 9.1% |
| Queens | 2,405,460 | 7.7% |
| Manhattan | 1,694,250 | 6.8% |
| Bronx | 1,472,650 | 6.2% |
| Staten Island | 495,750 | 5.6% |
| NYC | 8,804,190 | 7.6% |
Sources: U.S. Census Bureau; OSC analysis
The trend through 2019 suggests that growth in Brooklyn’s population was driven by an expansion of the non-immigrant population.2 From 2010 to 2019, Brooklyn had a 6 percent growth in the non-immigrant population, nearly double the citywide rate. This was coupled with a 4.5 percent decline in the immigrant population, the only borough to register a net decline in that group over this period.
Still, more than 900,000 Brooklyn residents were immigrants in 2019, representing 35.4 percent of Brooklyn’s population, the second-highest share among all the boroughs, after Queens with 47.6 percent. Brooklyn had the sixth-highest share of immigrants among the 829 largest counties nationwide.
While immigrants in Brooklyn come from more than 150 countries, the top 10 countries of origin account for more than half the immigrant population (see Figure 3). Of these, Brooklyn had more immigrants from each of the following countries than any other borough: Jamaica, Haiti and Trinidad and Tobago (with the largest numbers located in the neighborhoods of Canarsie/ Flatlands, East Flatbush/Farragut/Rugby and Crown Heights South/Prospect Lefferts/Wingate), and Ukraine and Russia (concentrated in the neighborhoods of Sheepshead Bay/Gerritsen Beach/Homecrest and Brighton Beach/Coney Island).
FIGURE 3: Immigrant Population in Brooklyn
| Top 10 Countries of Origin | Number in 2019 | Brooklyn Share of NYC |
|---|---|---|
| China | 122,700 | 34% |
| Jamaica | 67,300 | 39% |
| Dominican Republic | 56,400 | 14% |
| Haiti | 45,700 | 54% |
| Ukraine | 41,400 | 68% |
| Trinidad and Tobago | 41,000 | 58% |
| Russia | 38,900 | 62% |
| Mexico | 37,800 | 24% |
| Guyana | 37,000 | 29% |
| Ecuador | 19,100 | 17% |
| Subtotal | 507,150 | 32% |
| Total | 907,540 | 30% |
Note: Subtotal includes all other countries not listed in the figure.
Sources: U.S. Census Bureau; OSC analysis
Of all Brooklyn residents (including both non-immigrants and immigrants), 35.4 percent of the population reported their race/ethnicity as White in 2020, 26.7 percent as Black or African American, 18.9 percent as Hispanic or Latino, 13.6 percent as Asian American and Pacific Islander and 4.1 percent as Two or More Races.
The 2020 Census revealed that the nation’s population is more multiracial and multiethnic than was measured in the past.3 The fastest growing category of race/ethnicity in Brooklyn and the City over the last decade was Two or More Races. The number of respondents who selected this category grew by 249 percent in Brooklyn since 2010, 124 percent citywide and 276 percent nationwide.
In Brooklyn, Asian American and Pacific Islanders were the second-fastest growing segment (aside from those identified as “other”) of the population, increasing by 41 percent over the decade. Both the White and the Hispanic or Latino populations increased in Brooklyn over the period, but their growth was more modest, at 8.4 percent and 3.4 percent, respectively. The only segment that showed a decline was Blacks or African Americans (9.7 percent), which was greater than the decline citywide (5.1 percent).
Nearly 40 percent of the residents of Brooklyn aged 25 or older had attained at least a bachelor’s degree as of 2019, a higher share than in any other borough except Manhattan. This represented an increase of 10.6 percentage points since 2010, far more than in any other borough.
From 2010 to 2019, the median age of Brooklyn residents rose by 1.4 percentage points to reach 35.6 years, although it remained below the 37.2 years for all city residents.
Household Income and Poverty
The median household income in Brooklyn grew by 58.8 percent between 2010 and 2019. While this increase was far more than in any other borough, it remained below the citywide median (see Figure 4).
FIGURE 4: Median Household Income by Borough
| Borough | Median Household Income 2010 | Median Household Income 2019 | Change 2010-2019 |
|---|---|---|---|
| Brooklyn | $42,150 | $66,900 | 58.8% |
| Manhattan | $63,800 | $93,650 | 46.8% |
| Queens | $53,100 | $73,700 | 38.9% |
| Staten Island | $70,600 | $89,800 | 27.3% |
| Bronx | $32,600 | $41,400 | 27.2% |
| NYC | $48,700 | $69,400 | 42.4% |
Sources: U.S. Census Bureau, American Community Survey, 1-year estimates; OSC analysis
Seven of the 10 neighborhoods citywide with the highest growth rates in median household income from 2010 to 2019 were in Brooklyn. In fact, the top three neighborhoods citywide were Greenpoint/Williamsburg, which grew by 134.7 percent, Crown Heights North/ Prospect Heights, which grew by 93 percent, and Park Slope/Carroll Gardens/Red Hook, which grew by 87.2 percent.
Brooklyn has a mix of low-, moderate- and high-income neighborhoods. Of the borough’s 18 Census-defined neighborhoods, median household income in 2019 varied from a high of $155,250 in Park Slope/Carroll Gardens/ Red Hook to a low of $31,350 in Brownsville/ Ocean Hill (see Figure 5).4
FIGURE 5: Median Household Income by Neighborhood, 2019
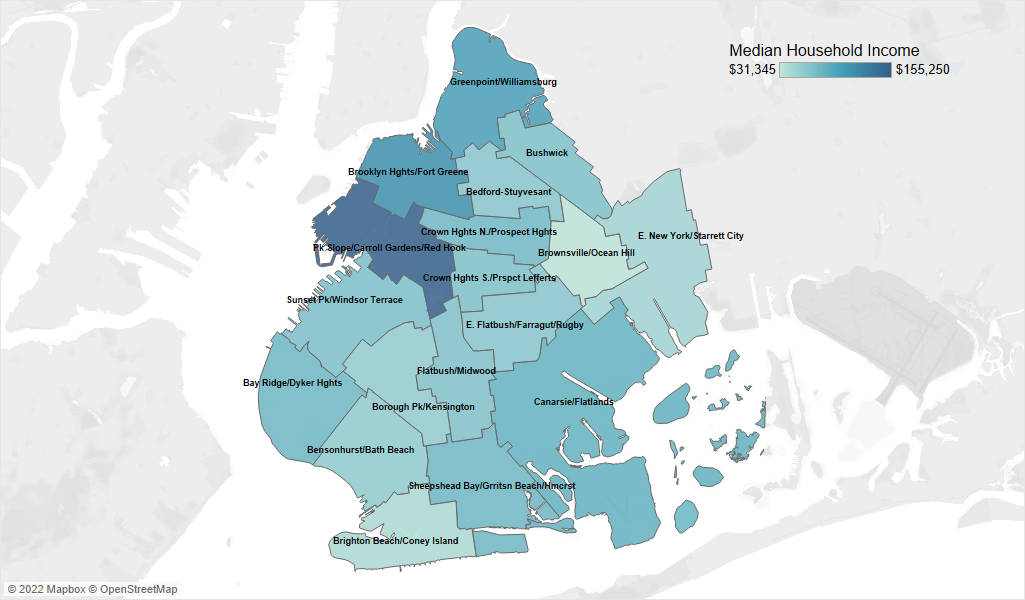
Source: U.S. Census Bureau, American Community Survey, 2019.
Household and child poverty rates in Brooklyn in 2019 (i.e., the share of households and children living below the poverty level) were the second-highest of the five boroughs (after the Bronx). Even so, both its household and child poverty rates declined since 2010 and by larger differences than for citywide, resulting in narrower gaps (see Figure 6).
FIGURE 6: Household and Child Poverty Rates
| Area | Percent in 2010 | Percent in 2019 | Difference |
|---|---|---|---|
| Households | |||
| Brooklyn | 21.5 | 17.3 | -4.2 |
| New York City | 18.7 | 16.4 | -2.3 |
| Children | |||
| Brooklyn | 34.0 | 24.5 | -9.5 |
| New York City | 30.0 | 22.2 | -7.8 |
Sources: U.S. Census Bureau American Community Survey, 1-year estimates; OSC analysis.
Among Brooklyn’s neighborhoods, Brownsville/Ocean Hill had the highest household and child poverty rates (33.4 percent and 47.4 percent, respectively) while Park Slope/Carroll Gardens/Red Hook had the lowest (7.1 percent and 6.6 percent, respectively) in 2019.
The four neighborhoods with the largest reductions in their child poverty rates between 2010 and 2019 within the borough (Flatbush/Midwood, Crown Heights North/ Prospect Heights, East New York/Starrett City and Bedford-Stuyvesant) had declines that ranged from 16 percentage points to 24 percentage points.
More than one-fifth of Brooklyn households (20.9 percent) received Supplemental Nutrition Assistance Program (SNAP) benefits in 2019, a higher share than citywide (18.6 percent), while more than one-third of Brooklyn residents (36.6 percent) received Medicaid, also a higher share than citywide (32.5 percent).
At the neighborhood level, nearly 40 percent of Brighton Beach/Coney Island households received SNAP benefits, and 55 percent of Borough Park/Kensington/Ocean Parkway residents received Medicaid, the highest shares of all neighborhoods in both cases.
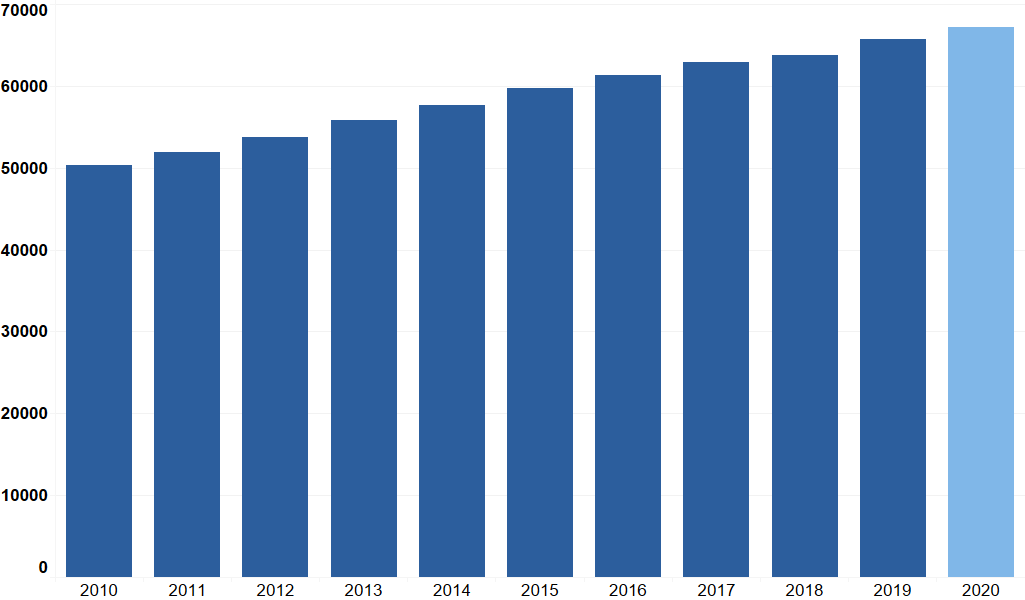
FIGURE 7: Private Sector Employment in Brooklyn
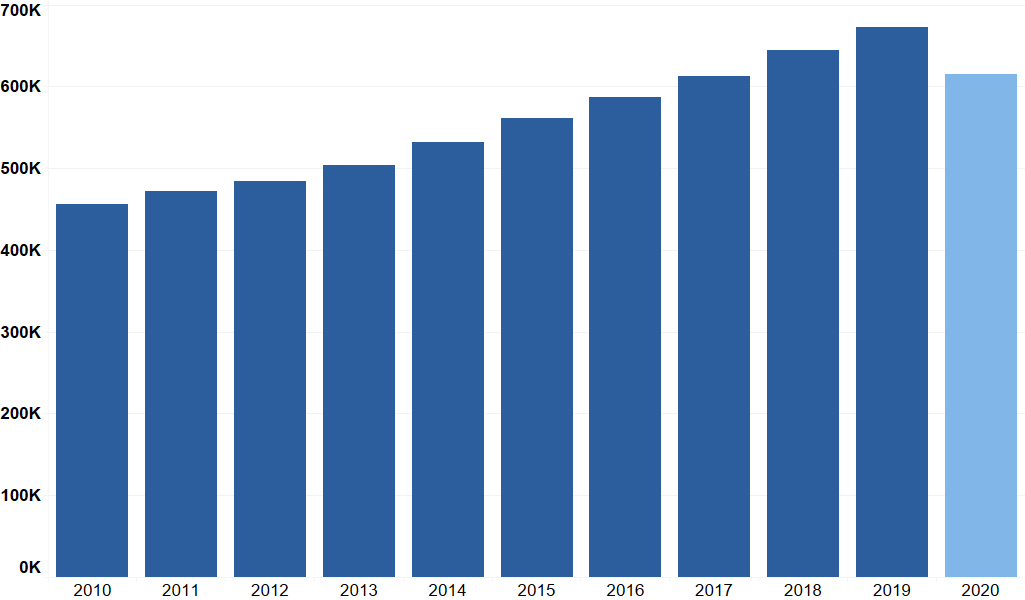
Note: 2020 is shaded in light blue for comparison.
Sources: NYS Department of Labor; OSC analysis
Employment Growth
Prior to the pandemic, Brooklyn added 216,460 total private sector jobs from 2010 to 2019 (see Figure 7). This represented employment growth of 47.5 percent, which was far faster than in any other borough. Citywide job growth was 28.7 percent.
Education and health services is the largest employment sector in Brooklyn (as in all the other boroughs except Manhattan) with 289,260 jobs in 2019 (see Figure 8). This is followed by trade, transportation and utilities with 124,230 jobs. The next largest sector, leisure and hospitality, experienced the fastest growth between 2010 and 2019. In fact, the sector grew by 109 percent, with nearly three-quarters of that growth located in restaurants and bars.
FIGURE 8: Brooklyn Employment by Sector, 2019
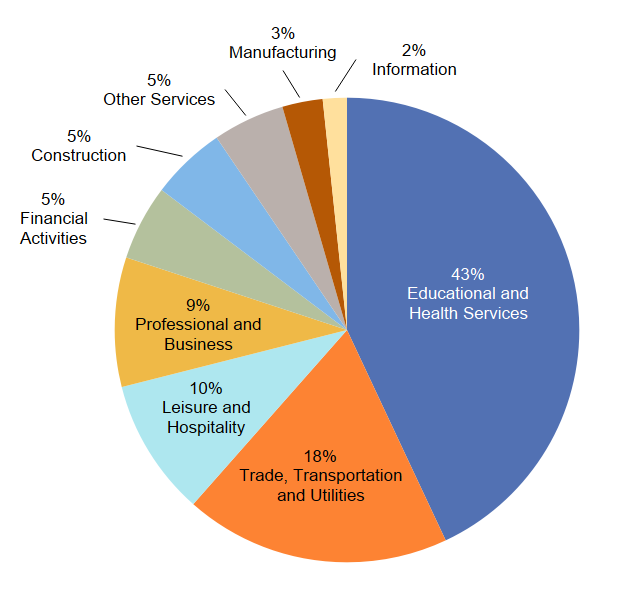
Sources: U.S. Census Bureau, American Community Survey, 1-year estimates; OSC analysis
Among Brooklyn’s neighborhoods, the three with the most employment in 2019 (together accounting for more than one-third of all jobs in the borough) were Brooklyn Heights/Fort Greene, Borough Park/Kensington/Ocean Parkway and Greenpoint/Williamsburg. The three neighborhoods with the fewest jobs were Crown Heights South/Prospect Lefferts/Wingate, Brownsville/Ocean Hill and East Flatbush/Farragut/Rugby.
Employment growth from 2010 to 2019 varied widely across the borough. Three neighborhoods doubled or nearly doubled their employment levels: Bedford-Stuyvesant with a growth of 104.8 percent, Borough Park/Kensington/ Ocean Parkway with 100.2 percent growth, and Sheepshead Bay/Gerritsen Beach/Homecrest with 93.5 percent growth (see Figure 9). Brooklyn Heights/Fort Greene had the slowest job growth with 20.2 percent and East Flatbush/Farragut/Rugby experienced a decline of 1.9 percent.
Total wages in Brooklyn (which reflect both average salaries and the number of jobs) grew by 74.5 percent from 2010 to 2019 to reach $30.5 billion, far faster than in any of the other boroughs, which ranged from 47 percent in the Bronx to 58.6 percent in Queens.
Brooklyn’s growth in total wages was due more to job growth than the rise in average salaries, which only increased by 18.3 percent over the same period, the lowest rate of all the boroughs. Brooklyn also had the lowest average salary in 2019 at $45,400. All other boroughs were below $53,000 except Manhattan with $131,800.
FIGURE 9: Change in Employment by Brooklyn Neighborhood, 2010 to 2019
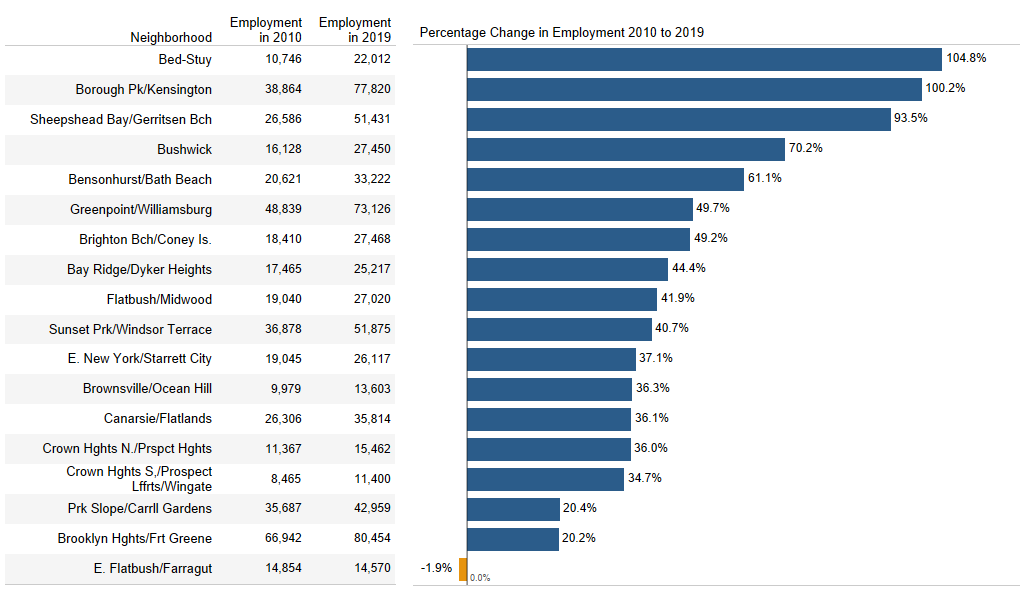
Sources: NYS Department of Labor; OSC analysis
Business Growth
Prior to the pandemic, Brooklyn experienced very strong business growth between 2010 and 2019 (see Figure 10) primarily because of the expansion of microbusinesses, defined by the U.S. Small Business Administration as those with fewer than 10 employees. The number of private sector businesses grew by 31.6 percent over this period, faster than in any other borough. Brooklyn’s rate of growth was more than double the rate in Staten Island, the Bronx and Manhattan and 50 percent higher than in Queens. More than 80 percent of the growth was in microbusinesses.
FIGURE 10: Brooklyn Private Sector Firms, 2010 to 2020
Note: 2020 is shaded in light blue for comparison.
Sources: NYS Department of Labor; OSC analysis
While expansion in the number of businesses occurred across many sectors, the fastest growing were information businesses, such as telecommunications firms, film companies, radio and TV broadcasting, and cable programming businesses (104.1 percent), leisure and hospitality firms (62.3 percent, mostly restaurants and bars) and business services firms (51.4 percent). The latter two sectors accounted for more than one-third of the new businesses in the borough.
The number of businesses in each of Brooklyn’s neighborhoods ranged from 1,110 in Brownsville/Ocean Hill to 6,750 in Greenpoint/Williamsburg. Many neighborhoods experienced an increase in the number of businesses, while Bedford-Stuyvesant had the fastest increase of 75 percent from 2010 to 2019.
Resident Work Force
Brooklyn had 1.2 million working residents in 2019, with average earnings of $64,600 compared to $73,300 for the City as a whole.5 Among Brooklyn’s neighborhoods, three had average earnings above $88,000 in 2019 and were among the top 10 citywide (Park Slope/Carroll Gardens/Red Hook, Brooklyn Heights/Fort Greene and Greenpoint/Williamsburg). Five neighborhoods in the borough had average earnings below $50,000 (Brighton Beach/Coney Island, Bushwick, Bensonhurst/Bath Beach, East New York/ Starrett City and Brownville/Ocean Hill).
The pandemic has drawn attention to the extent to which certain industries or occupations can adapt to remote work. Those in face-to-face industries, such as health care, retail trade, accommodation and food services, transportation and warehousing, construction, personal services (e.g., nail salons and automotive repair), arts and entertainment, and manufacturing, faced a higher risk of contracting COVID-19 through work activities and higher risk of becoming unemployed.6 Citywide, more residents (over three-quarters) work in these industries than in those conducive to working remotely, such as business services and financial activities.
In 2019, nearly 23 percent of the workforce in Brooklyn was employed in industries conducive to working remotely, in line with citywide (23.1 percent). Among the five boroughs, Manhattan had the highest share of 40 percent, whereas in Staten Island, Queens and the Bronx, less than 19 percent of the workforce was employed in remote industries.
Within Brooklyn, the share of the working residents located in remote industries varied widely across neighborhoods from 44 percent (Greenpoint/Williamsburg) to 7.9 percent (East New York/Starrett City) in 2019. Generally, the higher the share of residents who worked in industries conducive to working remotely, the higher the median household income (and annual average earnings per worker) for that neighborhood (see Figure 11).
FIGURE 11: Share of Area Workforce in Remote Industries
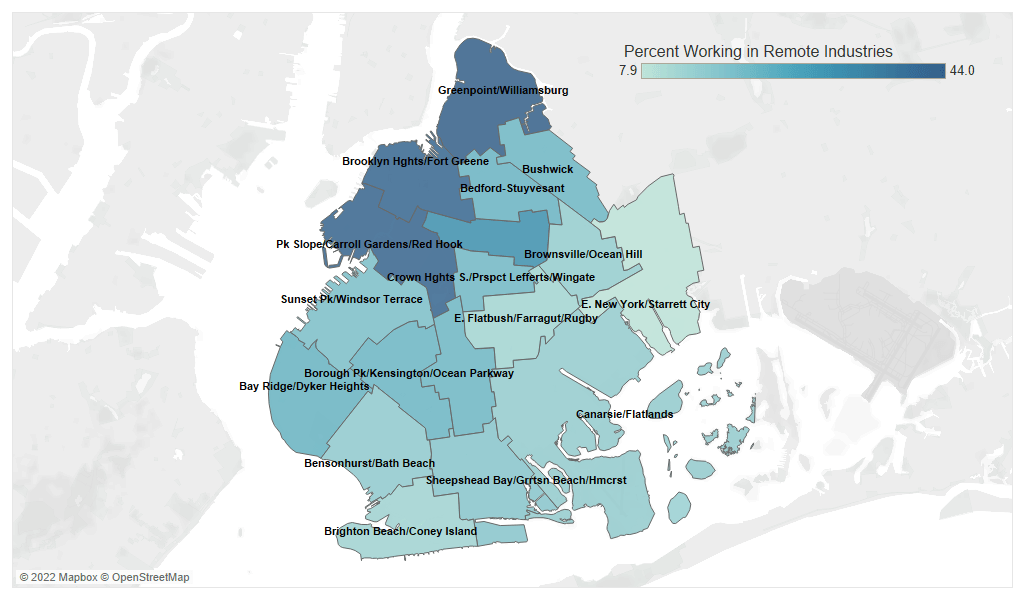
Source: U.S. Census Bureau, American Community Survey, 2019
COVID-19 Health Impacts
In the spring of 2020, New York City was the epicenter of the COVID-19 pandemic in the United States. Since then, the City has had multiple pandemic waves as the spread of COVID-19 has ebbed and flowed with the diffusion of new variants.7 With the development of vaccines and better treatments for the virus, the severity of outcomes from getting infected has improved, particularly among the vaccinated population.
FIGURE 12: Cumulative Cases, Hospitalizations and Deaths from COVID-19 by Borough
| Borough | Cases | Hospitalizations | Deaths | Case Rates | Hospitalization Rates | Death Rates |
|---|---|---|---|---|---|---|
| Bronx | 406,702 | 34,411 | 7,715 | 28,677 | 2,426 | 544 |
| Brooklyn | 694,279 | 48,327 | 12,783 | 27,121 | 1,888 | 499 |
| Manhattan | 399,305 | 22,820 | 5,430 | 24,517 | 1,401 | 333 |
| Queens | 637,778 | 44,359 | 11,834 | 28,297 | 1,968 | 525 |
| Staten Island | 165,346 | 8,984 | 2,310 | 34,726 | 1,887 | 485 |
| NYC | 2,303,961 | 158,925 | 40,073 | 27,636 | 1,906 | 481 |
Note: Rates are per 100,000 people; data as of March 29, 2022.
Sources: NYC Department of Health and Mental Hygiene; OSC analysis
Looking at the cumulative impact of the pandemic since its beginning, Brooklyn had the highest number of total cases, hospitalizations and deaths from COVID-19 as of March 2022, consistent with the borough being the most populous of the City’s five (see Figure 12). In terms of rates, however, Brooklyn had the second-lowest cumulative case rate, and third-lowest cumulative hospitalization and death rates among the five boroughs.8
Rates varied significantly across the 37 ZIP Code areas of Brooklyn’s 18 neighborhoods.9 Cumulative rates of 17,199 cases per 100,000 residents and 171 deaths per 100,000 residents in Gowanus/Park Slope/Windsor Terrace (ZIP Code 11215) were the lowest, and significantly below the respective citywide averages shown in Figure 12. Cumulative rates of 33,489 cases per 100,000 residents and 1,390 deaths per 100,000 residents in East New York (ZIP Code 11239) were the highest, and well above the respective citywide averages.
Although many factors affect the rate at which residents have become infected and the severity of COVID-19’s impact, there appears to be a general correlation between neighborhoods with higher median household incomes and lower poverty rates, and lower cumulative case rates and death rates.
Before the fifth wave of the pandemic took hold in December 2021 (driven by the Omicron variant of the COVID-19 virus), the severity of the pandemic’s impact had been receding as monthly hospitalization and mortality rates declined substantially in all boroughs. The variant caused cases and positivity rates to surge to levels exceeding the pandemic’s prior peak in the spring of 2020, although the number of hospitalizations and deaths have not risen as sharply.
For Brooklyn, the monthly average hospitalization rate fluctuated downward from 136 people hospitalized per 100,000 residents in January 2021 to 20 people in November 2021, then increased sharply to reach 212 people in January 2022 (see Figure 13). The mortality rate fluctuated downward from 28 deaths per 100,000 people in January 2021 to four deaths per 100,000 people by November 2021, before increasing sharply to reach 44 deaths per 100,000 people in January 2022. Hospitalization and mortality rates declined to 26 per 100,000 people, and 13 per 100,000 people, respectively, in February 2022.
FIGURE 13: Monthly Average COVID-19 Hospitalization Rates (per 100,000 residents)
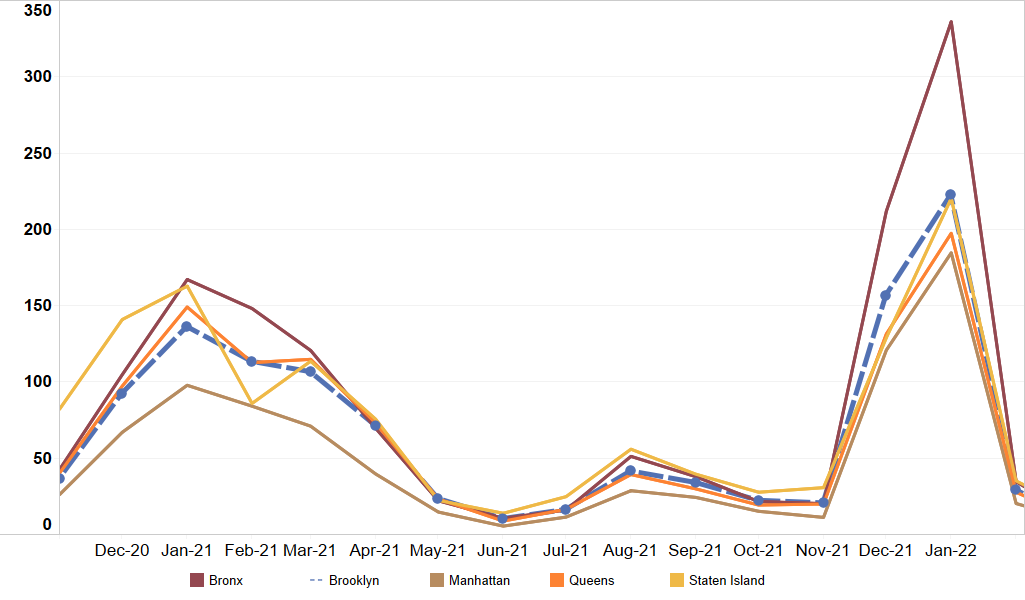
Note: Data as of March 29, 2022
Sources: NYC Department of Health and Mental Hygiene; OSC analysis
Seven-day positivity rates peaked in Brooklyn at 32.2 percent and across the City (35.0 percent), then declined. As of March 26, 2022, the seven-day positivity rate was 2.5 percent for Brooklyn, the same as for the City as a whole.
Vaccinations
After the first vaccines against COVID-19 were approved for adult use in the United States in December 2020, eligibility was expanded in phases over the next year, so that by November 2021, all adults and all children ages 5 and over were eligible. Accordingly, vaccination rates rose significantly from May 2021, when just 52 percent of the adult population across the City was fully vaccinated, to March 29, 2022, when 87 percent of adults were fully vaccinated (see Figure 14).10
FIGURE 14: COVID-19 Vaccinations by Borough
| Percent Fully Vaccinated | |||
|---|---|---|---|
| Borough | Adults May 2021 |
Adults March 2022 |
All Ages March 2022 |
| Bronx | 44% | 85% | 74% |
| Brooklyn | 46% | 82% | 71% |
| Manhattan | 61% | 88% | 82% |
| Queens | 56% | 94% | 85% |
| Staten Island | 50% | 85% | 74% |
| New York City | 52% | 87% | 78% |
Note: Percentage of respective populations, as of March 29, 2022.
Source: NYC Department of Health and Mental Hygiene
As with positivity rates, vaccination rates vary widely across Brooklyn, with the share of all ages of residents fully vaccinated ranging from 53 percent in Borough Park (ZIP Code 11219) to more than 100 percent in Sunset Park (ZIP Code 11220), as of March 29, 2022.11
Economic Impact of the Pandemic
In March 2020, the pandemic resulted in a sudden economic shutdown, followed by a phased re-opening. By the second quarter of 2020 the City had 812,500 fewer private sector jobs than in the previous quarter. (See Figure 15, next page. Data is not seasonally adjusted.) In Brooklyn, the shutdown caused private sector employment in the second quarter of 2020 to decline by 145,000 jobs from the previous quarter (or by 129,400 jobs from one year earlier). Businesses designated as non-essential which required face-to-face work were hit the hardest, while essential sectors and those that could transition to remote work had smaller employment declines.
As shown in Figure 15, the pace of job recovery in Brooklyn, measured by the change from the first quarter of 2020 employment level, is ahead of the City’s. In the second quarter of 2020, employment in Brooklyn was lower than in the previous quarter in all sectors except information, reflecting the impact of the pandemic. By the third quarter of 2021 employment had increased in all sectors except financial activities and educational services.
Figure 15 also shows that, by the third quarter of 2021, the social sector (which includes many face-to-face services) and the information sector (which is suited to and facilitates remote work) had the fastest jobs recovery in Brooklyn. Conversely, job recovery appeared slowest in the transportation and warehousing, construction, and educational services sectors.
Overall, Brooklyn businesses showed a similar pattern to that of employment in the borough. Between the first and second quarter of 2020 the total number of private sector firms in the borough declined slightly, then increased by the third quarter of 2021, measuring one-half percent higher than at the start of the pandemic.
FIGURE 15: Change in Employment in Brooklyn by Sector as of Third Quarter, 2021
| Sector | Employment Levels | Change in Employment | Percent Change From Q1 2020 Employment Level | |||
|---|---|---|---|---|---|---|
| Q1 2020 | Q2 2020 | Q3 2021 | Q1 2020 to Q2 2020 | Q2 2020 to Q3 2021 | ||
| Construction | 33,765 | 22,587 | 29,601 | -11,178 | 7,014 | -12.3 |
| Manufacturing | 18,867 | 13,330 | 16,983 | -5,538 | 3,653 | -10.0 |
| Wholesale Trade | 22,715 | 17,712 | 20,381 | -5,003 | 2,669 | -10.3 |
| Retail Trade | 76,411 | 56,136 | 72,147 | -20,274 | 16,011 | -5.6 |
| Transportation and Warehousing |
21,758 | 12,138 | 16,366 | -9,621 | 4,228 | -24.8 |
| Information | 13,068 | 11,981 | 12,835 | -1,087 | 854 | -1.8 |
| Financial Activities | 35,050 | 32,132 | 31,365 | -2,917 | -768 | -10.5 |
| Professional and Business | 63,388 | 53,855 | 59,453 | -9,533 | 5,599 | -6.2 |
| Educational Services | 33,862 | 29,098 | 27,865 | -4,764 | -1,233 | -17.7 |
| Health Care | 189,979 | 165,842 | 182,669 | -24,137 | 16,827 | -3.8 |
| Social Assistance | 80,419 | 72,325 | 84,751 | -8,094 | 12,426 | 5.4 |
| Leisure and Hospitality | 61,456 | 30,058 | 56,521 | -31,398 | 26,463 | -8.0 |
| Other Services | 35,979 | 24,588 | 34,224 | -11,391 | 9,636 | -4.9 |
| Brooklyn Total | 686,716 | 541,781 | 645,161 | -144,935 | 103,380 | -6.1 |
| New York City Total | 3,901,015 | 3,088,549 | 3,512,863 | -812,467 | 424,315 | -10.0 |
Note: Calculations are subject to rounding
Sources: NYS Department of Labor; OSC analysis
Trends varied when viewed by business size. While Brooklyn businesses with 10 or more employees declined by 27.6 percent between the first and second quarters of 2020, the number of microbusinesses (those with fewer than 10 employees) increased by 4.5 percent. Although the pattern reversed as the City re-opened, there was still 1.6 percent more microbusinesses by the third quarter of 2021 than at the start of the pandemic, and 5.6 percent fewer firms of all other sizes combined. Microbusinesses made up 84.7 percent of all Brooklyn businesses in 2019.
Unemployment
For the five years prior to the pandemic from 2015 to 2019, Brooklyn’s annual unemployment rate was second highest of the five boroughs and tended to be only slightly higher than the citywide rate. After averaging 4.1 percent in the first three months of 2020, unemployment in the borough rose rapidly (as it did throughout the City) to reach 21.2 percent in May 2020 as the pandemic unfolded and non-essential face-to-face businesses were shut down (see Figure 16). Brooklyn's unemployment rate has since gradually declined (as it has throughout the City) to reach 6.3 percent as of March 2022, the lowest level since the start of the pandemic, still slightly higher than the citywide rate (6.1) percent.
FIGURE 16: Unemployment Rates by Borough Since 2020
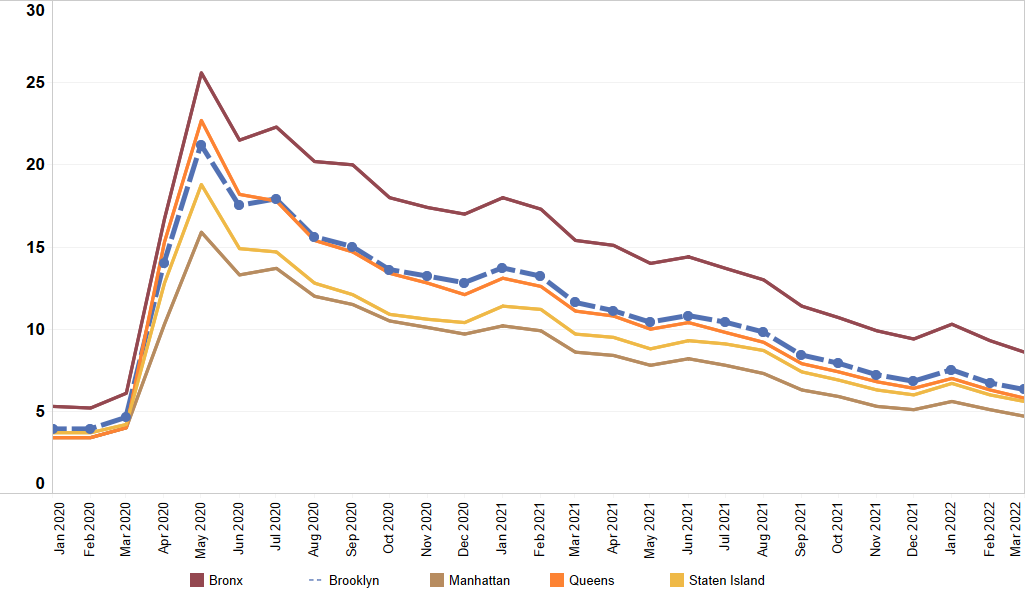
Sources: NYS Department of Labor; OSC analysis
Commuting to Work
The Brooklyn segment of the City’s public transportation system is one of the most extensive of the five boroughs, with more than 60 local, limited and express bus routes, and 157 subway stations and complexes. In 2019, Brooklyn had the second-highest share of residents using public transportation to get to work (61 percent) among the five boroughs (after the Bronx) and higher than the citywide share (55 percent).12 The share of Brooklyn residents that walked to work (8.4 percent) that year was the second highest after Manhattan.
In April 2020, Brooklyn subway ridership fell to 10.9 percent of the April 2019 level, the second highest after the Bronx (17.9 percent).13 By December 2021, the overall borough ridership was still less than half of 2019 levels. At the neighborhood level, ridership had recovered to one-half or more of the 2019 levels in Bensonhurst/Bath Beach, Borough Park/ Kensington/Ocean Parkway, Brighton Beach/ Coney Island and Sunset Park/Windsor Terrace by February 2022. These were also among the 10 neighborhoods across the City with the highest ridership levels in that month, neighborhoods with relatively low median household incomes.
The mean travel time to work for Brooklyn residents in 2019 was 43.8 minutes, higher than the mean time for all of the City (41.7 minutes). For 10 Brooklyn neighborhoods, the mean travel time to work was higher than the borough average, and the health care and social assistance sector accounted for the highest share of residents’ employment.
Housing
The pandemic has driven changes in the nation’s housing market. In the State, the City has been an outlier in terms of migration patterns that have influenced the market. Specifically, while domestic migration to and within the City increased from an average of 5.7 percent of its population over 2015 to 2019 to 6.7 percent in 2021, the rest of the State experienced a decline from an average of 7.3 percent to 6.2 percent, based on an analysis of the U.S. Census Bureau’s Current Population Survey.14 This divergence was due, in part, to persons moving out of an existing household to establish a new one during the pandemic.
With the largest population among the boroughs, Brooklyn also has the most housing units at nearly 1 million in 2019, over 30 percent of the citywide total. Of these, 70 percent were rentals compared to two-thirds citywide. The Bronx and Manhattan, however, had even higher shares of rental units than Brooklyn.
According to the U.S. Census Bureau, the median rent in Brooklyn was $1,480 in 2019, the same as citywide. Rents in the borough grew by 37.5 percent from 2010 to 2019, the fastest rate among all the boroughs (see Figure 17). Within the borough, median rents ranged from among the highest of all the City’s 55 neighborhoods to among the lowest. Park Slope/Carroll Gardens/ Red Hook had a median rent of $2,330 and ranked fourth citywide, while Brighton Beach/ Coney Island had the lowest median rent in Brooklyn ($1,080) and ranked 52nd citywide.
FIGURE 17: Percent Change in Median Rent, 2010 to 2019, New York City and Boroughs
Sources: U.S. Census Bureau, ACS 1-year file; OSC analysis
According to rental index data from Street Easy, the median market-rate rent in Brooklyn reached a high of $2,729 in March 2020, just as the pandemic was beginning to take hold. As of November 1, 2021, the median market-rate rent has exceeded its pre-pandemic peak.
Now, and even prior to the pandemic, housing affordability has been a key problem in Brooklyn as it has been citywide (and nationally). Half of all rental households in Brooklyn faced a rent burden in 2019. These households had a rent equal to 30 percent or more of their incomes (the threshold at which housing costs are considered a burden). More than one-quarter (26.2 percent) faced a severe rent burden, also the same share as citywide. These households had a rent equal to at least half of their incomes.
Park Slope/Carroll Gardens/Red Hook had the lowest share of households facing either a rent burden (one-third) or a severe rent burden (13.6 percent) while Borough Park/ Kensington/Ocean Parkway and Brownsville/Ocean Hill (where median household income was lowest) had the highest shares of households facing a rent burden (nearly two-thirds of the households in each neighborhood) and a severe rent burden (nearly 40 percent of the households).
There were more than 290,000 owner-occupied housing units in Brooklyn in 2019. The value of these homes has risen significantly over the past decade. According to the U.S. Census Bureau, the median home value rose by 40 percent since 2010 (faster than in any other borough) to reach $794,000 in 2019, second only to Manhattan ($1,128,000). The pre-pandemic median market-rate home value in Brooklyn was $700,640, and, as of November 1, 2021, was $674,000, slightly below its February 1, 2020 value.
More than one-third (36.6 percent) of homeowners faced a housing cost burden in 2019, while one-fifth (20.1 percent) faced a severe housing cost burden. These were higher than the shares of homeowners in the City overall that faced a housing cost burden (32.2 percent) and a severe housing cost burden (16.5 percent).
COVID-19 Housing Relief
The pandemic brought a serious housing affordability problem, in Brooklyn and throughout the City, to the forefront, as job and income losses affected City residents’ ability to pay rent or cover housing costs. As with the rest of the City, relief from possible eviction of renters in Brooklyn came from the closure of housing courts between April and June of 2020, then from a State eviction moratorium. The moratorium was extended three times before it expired on January 15, 2022.
The City’s average monthly eviction filings since the courts re-opened have been less than 40 percent of the average level for 2016 through 2018.15 With the moratorium expired, court actions across the City, including Brooklyn, are expected to increase. In fact, as of January 23, 2022, eviction filings for Brooklyn ZIP Code areas 11206, 11212 and 11224 (Williamsburg (South), Ocean Hill-Brownsville and Brighton Beach/Coney Island/Seagate, respectively) were above 90 percent of the historical levels.16
While evictions were suspended, rent arrears mounted as renters faced pandemic hardships. To ease the burden for lower-income renters, the State implemented the federally-funded Emergency Rental Assistance Program (ERAP) to help make payments to landlords. The New York State Office of Temporary and Disability Assistance reports a total of 320,545 ERAP applications were received from New York State residents as of March 23, 2022, and $2.0 billion was committed for payment.17 A total of $1.7 billion was paid out to all State residents. Of that amount, $1.4 billion went to the City, with Brooklyn receiving $421.7 million, a slightly smaller share than the 33 percent of low-income rental households (or those earning less than 80 percent of the area median income) in the City.18
New York State COVID relief for property owners through 2021 was made up mainly of a mortgage foreclosure moratorium and receipt of tenants’ arrears payments through the ERAP. On January 3, 2022, the State launched a federally-approved Homeowner Assistance Fund (HAF) to assist low- to moderate-income applicants with up to $50,000. Eligible expenses include mortgage payments, property taxes, water and sewer bills, cooperative and condo unit maintenance fees, and chattel loans and retail installment payments for manufactured homes.
HAF applications are expected to exceed available funding of $539 million. While the HAF application window is now closed, pending applications are still being processed. As of March 21, 2022, New York City accounted for 44 percent of the 30,785 applications processed for the State.19 Applications for mortgage reinstatement made up 75 percent of the total, and the balance was for non-mortgage arrears.
Food Insecurity
Hunger Free America estimates that the number of individuals who were food insecure in Brooklyn for the 2018 to 2020 three-year period was the highest among the five boroughs, and amounted to an average of 14.1 percent of borough residents.20 This was the same as the borough’s child food insecurity rate, and lower than the City’s average food insecurity rate (19.0 percent). Reflecting the impact of the pandemic, the borough’s food insecurity rate was higher than the average of 11.5 percent for the 2015 to 2017 three-year period (when the City’s average rate was 12.8 percent).
The increase in food insecurity was reflected in higher demand at food pantries. Some 27 percent of Brooklyn residents used food pantries in 2020 compared to a pre-2020 four-year average of 12 percent.21 These rates were almost the same for the City as a whole. In response, almost one-half of the City’s food pantries increased hours of operation between March and June of 2020, even as one-third were forced to close (in part because many volunteers were at higher risk for COVID-19 infections and so unable or unwilling to work).22
Measures taken to address the increase in food insecurity at the local and federal levels complemented changes in the emergency food network.23 Within weeks of the pandemic onset, in 2020, the City implemented a plan to ensure residents had access to adequate supplies of food during the emergency. In February 2021, an interagency plan to meet residents’ food needs in the near-, medium- and long-term was launched.
Immediate measures for food relief (up to 2022) included supporting food pantries, supplying meals for pickup at local schools and delivering food to seniors at home.24 Medium-term (2023 to 2024) and long-term (2025 and onward) measures included education campaigns, support for food distribution workers, and improvement in procurement, storage and distribution of food.
State and federal measures included income support to households through temporary expansion of unemployment insurance and the SNAP, and through stimulus payments (grants) to citizens during the heights of the pandemic.25
Education and Broadband Internet
Education
The COVID-19 pandemic has exacerbated long-term trends of declining enrollment across City schools (see OSC’s report on the New York City Department of Education).26 Over the last five years, Brooklyn has accounted for slightly more than 30 percent of the City’s total Pre-K through 12th grade enrollment, and the borough’s enrollment decline last year was above 3.3 percent. This was similar to all other boroughs except Staten Island, where enrollment declined less than one percent.
In Brooklyn, the New York City Department of Education served more than 330,000 students in the 2020-21 school year, a 3.3 percent decline from the previous year according to official City data. Most of the decline was concentrated in younger grade levels, with Pre-K and 3-K enrollment declining by more than 15 percent and elementary enrollment declining by nearly 4.4 percent in that year, mirroring citywide trends.
Of the borough’s 580 schools, 93 are charter schools, which saw a 4.7 percent growth in enrollment despite the pandemic. This also followed historical trends at the City level.
The pandemic has disrupted historical methods of tracking and measuring student progress (such as standardized testing) and has lowered student attendance rates, even though City schools resumed in-person instruction for all students at the beginning of the 2021-22 school year. With students back in the classroom full-time, daily attendance in Brooklyn averaged just 85.5 percent for the fall of 2021, lower than the 91.6 percent average recorded over the six years prior to the pandemic (the same as citywide).
Broadband Internet Access
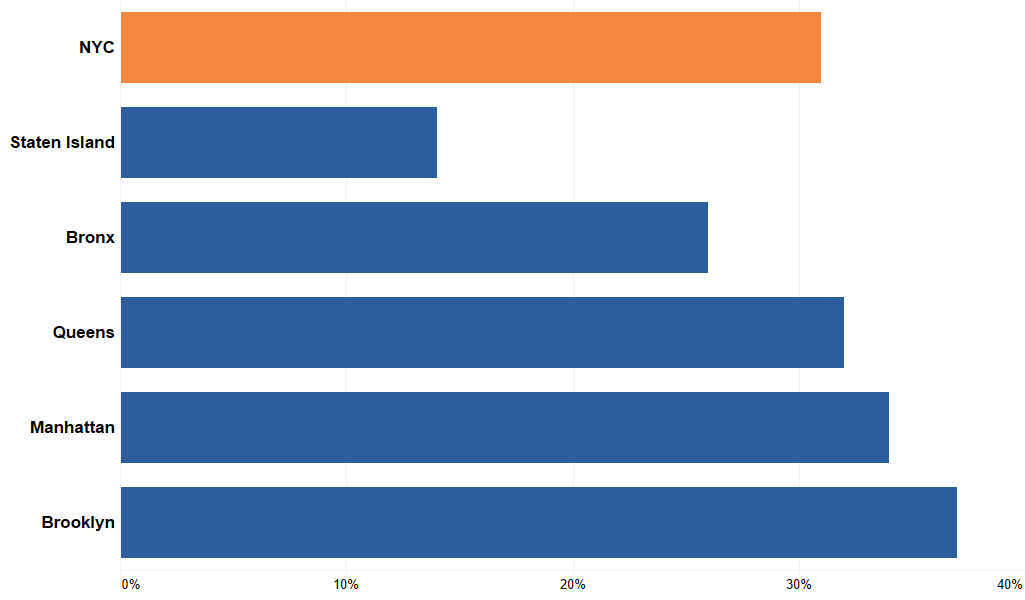
The COVID-19 pandemic highlighted existing inequalities in broadband internet access as families shifted to working from home and to distance learning.27 While Brooklyn had the second-lowest share of households without broadband internet subscriptions among the five boroughs in 2019 (27.3 percent), there were wide disparities within the borough (see Figure 18).28 Neighborhoods with lower median household incomes tended to have a higher percentage of households with no broadband access.
FIGURE 18: Shares of Brooklyn Neighborhood Households with No Broadband Access, 2019
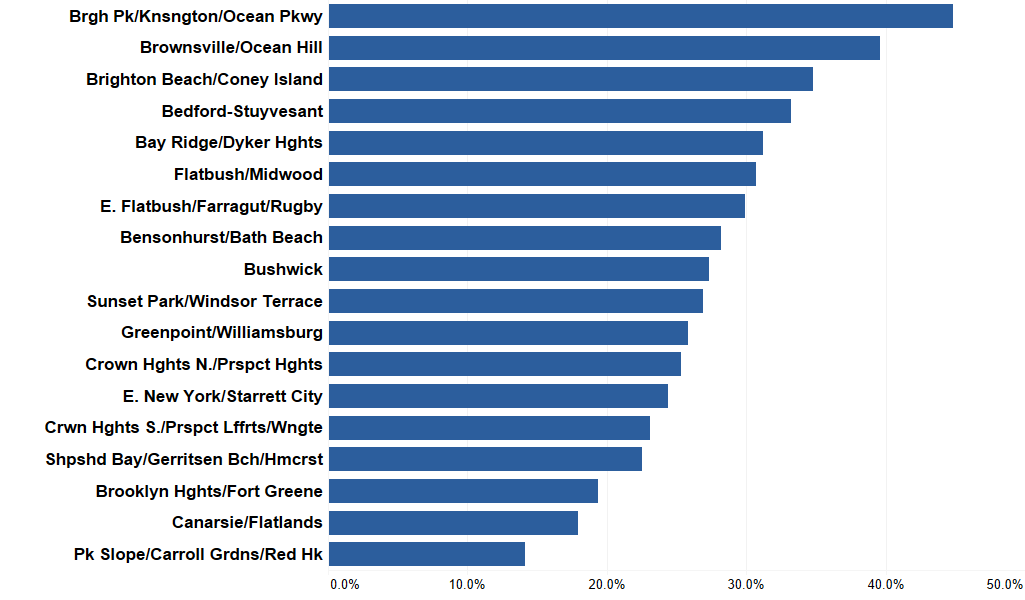
Sources: U.S. Census Bureau, American Community Survey, 1-year estimates; OSC analysis
The neighborhoods of Borough Park/ Kensington/Ocean Parkway and Brownsville/ Ocean Hill, which had the highest shares of households with no connection, were cited among 11 areas that could benefit from the City’s efforts to improve broadband access in lower-income communities, including the settlement of a years-long suit against a major internet service provider (ISP). Other Brooklyn neighborhoods included were Crown Heights North/ Prospect Heights and Bushwick.
Efforts to improve the ability of lower-income families to access broadband service also included the adoption of a federal Emergency Broadband Benefit (EBB) program that provides payments of up to $50 per month for connectivity. As of November 23, 2021, Brooklyn residents accounted for the highest share (28.6 percent) of EBB subscriptions across the five boroughs. The City accounted for just over one-half of all New York State EBB subscriptions.
Crime
Major crime in Brooklyn (i.e., murder, rape, robbery, felony assault, burglary, grand larceny, and grand larceny auto) declined by 42 percent between 2000 and 2010, similar to the rate citywide. In the following decade, the decline in major crime slowed but still fell by 16 percent in Brooklyn, compared to a 9 percent drop citywide.
The violent and property crime rates in Brooklyn in 2019, the last year comparable population data was published, were 419 crimes and 653 crimes, respectively, per 100,000 residents. Brooklyn crime rates were lower than both the citywide violent and property crime rates (434 crimes and 713 crimes, respectively).
Citywide, major crime in 2021 grew by 7 percent from 2020, greater than the slight increase in Brooklyn (1 percent). A decrease in most major crimes in Brooklyn was offset by increased incidents of grand larceny (10 percent), felony assault (7 percent), and grand larceny auto (1 percent). Shootings in Brooklyn, which accounted for one-third of the citywide total, dropped by 20 percent, compared to a small increase citywide which brought that total to its highest number since 2006 (1,562 shootings).
Subway crime in Brooklyn in 2021 fell by 9 percent compared to 2020, contrary to the small growth citywide (1 percent). Crime within Brooklyn’s public housing increased by 10 percent, outpacing the citywide growth in housing crime of 7 percent. The number of hate crimes in Brooklyn grew by 44 percent to 134, mostly consisting of anti-Jewish incidents (58). Citywide, hate crimes grew by 97 percent.
Pandemic Relief Programs
As with other areas of the City, Brooklyn residents relied on federal, State and local programs for pandemic relief through much of 2020 and 2021. Brooklyn businesses received one-fifth of all federal Paycheck Protection Program (PPP) loans and just under one-third of federal Economic Injury Disaster Loans (EIDLs) and advances for New York City (see Figure 19).29 The borough also accounted for significant shares of the City’s Restaurant Revitalization Fund (RRF) and the Shuttered Venue Operators Grant (SVOG) dollars.
Paycheck Protection Program
The PPP was the single largest COVID-19 relief program for small businesses at the federal level, with lending rounds in 2020 and 2021.30 Businesses with 2020 loans were allowed to borrow again in 2021. Brooklyn businesses received the second-highest number of PPP loans and loan dollars among the five boroughs for both years.
FIGURE 19: Federal COVID-19 Relief Resources Accessed by Brooklyn Small Businesses
| Program | Area Loan or Grant Dollars (in millions) | Grant or Forgiven Loan Share* | Share of City Loan and Grant Dollars | |
|---|---|---|---|---|
| As of March 2022 | ||||
| Paycheck Protection Program | $6,117 | 71.8% | 19.9% | |
| Restaurant Revitalization Fund | $382 | 100.0% | 13.8% | |
| Shuttered Venue Operators Grant | $193 | 100.0% | 11.7% | |
| As of December 2020 | ||||
| Economic Injury Disaster Loan | $3,218 | 0.0% | 32.4% | |
| Economic Injury Disaster Loan Advance | $218 | 100.0% | 29.9% | |
*Figures in this column indicate the proportion of funds that are either forgiven (loans) or need no repayment (grants). Forgiveness is not provided for EIDLs, which have repayment periods of up to 30 years with interest rates of no more than 3.2 percent.
Sources: U.S. Small Business Administration; OSC analysis
Three neighborhoods (Greenpoint/Williamsburg, Brooklyn Heights/Fort Greene and Borough Park/Kensington/Ocean Parkway) accounted for just over one-quarter of all loans and one-third of total loan dollars approved for the borough.
Brooklyn’s health care, business services and construction were among the top-four borrowing sectors in both years of PPP lending and, along with the leisure and hospitality sector, accounted for one-half of all PPP loan dollars approved for the borough in 2021, as well as for both years combined. In 2020, the top-four borrowing sectors included retail trade.
First time borrowers in Brooklyn, as well as in the Bronx and Queens, accounted for a higher share of first-draw loans and loan dollars approved for the City in 2021 than their respective borough shares of PPP loans to the City in 2020. The share approved for Manhattan businesses was lower, and that for Staten Island businesses was the same. Reflecting measures to improve access to PPP resources by the smallest businesses, the share of Brooklyn loans taken up by firms with fewer than 20 employees increased from 91 percent in 2020 to 97 percent in 2021.
Economic Injury Disaster Loans and Advances
While data for 2021 COVID-19 EIDLs at the county level or below is not available to the public, a summary report shows that New York State received a total of $32.3 billion EIDLs, $652.3 million EIDL advances and $285.1 million supplemental targeted EIDL advances as of March 24, 2022.31 Detailed data released for 2020 showed that Brooklyn received the highest shares of EIDL funding (among the five boroughs) to the State, at 18.3 percent of EIDLs and 16.3 percent of EIDL advances.
Restaurant Revitalization Fund
Data released on the RRF showed that a total of 1,333 grants amounting to $382 million were approved for Brooklyn area restaurants by June 30, 2021. This represented 24.3 percent and 13.8 percent, respectively, of total RRF grants and grant dollars approved for the City. In Brooklyn, women-owned businesses, as well as businesses in either low- and moderate-income (LMI) areas or historically underutilized business (HUB) zones were awarded higher shares of RRF grant dollars than citywide (see Figure 20).32
FIGURE 20: Share of Brooklyn and New York City RRF Grant Dollars by Equity Indicator
| Indicator | Brooklyn | NYC |
|---|---|---|
| Low and Medium Income | 38.1 | 15.3 |
| HUBZone | 45.0 | 22.4 |
| Socioeconomically Disadvantaged | 33.5 | 36.8 |
| Women-Owned | 33.4 | 27.5 |
Sources: U.S. Small Business Administration; OSC Analysis
Shuttered Venue Operators Grants
As of March 28, 2022, Brooklyn businesses accounted for 11.7 percent of the SVOG grant dollars approved for the City, second to Manhattan (with 84.4 percent). As with the rest of the City, most awards for venues in the borough were approved in July of 2021, more than a year after the initial shutdown.
Organizations in Brooklyn Heights/Fort Greene, Bushwick, Greenpoint/Williamsburg and Park Slope/Carroll Gardens/Red Hook accounted for just under three-quarters of awards to the borough. Live performing arts organization operators and live venue operators or promoters received 70 percent of SVOG grants to the borough, compared to 46 percent in the City as a whole.
Open Streets: Restaurants
In June 2020, the City expanded its Open Streets program to allow restaurant service in designated sidewalk, parking lot and roadway areas. As of March 28, 2022, Brooklyn restaurants accounted for just under one-quarter of all Open Streets: Restaurants permits issued across the five boroughs. Three neighborhoods (Greenpoint/ Williamsburg, Brooklyn Heights/Fort Greene and Park Slope/Carroll Gardens/Red Hook) accounted for just under one-half of all Brooklyn permits.
Economic Centers and Innovation Districts
Despite the slowdown caused by the COVID-19 pandemic, there have been notable developments across Brooklyn’s many economic centers, suggesting that the borough is set to resume the pre-pandemic growth trend noted between 2010 and 2019.
Beyond the Brooklyn Tech Triangle
The Brooklyn Tech Triangle is one of several innovation districts located across the borough.33 It includes the Downtown Brooklyn, DUMBO (Down Under the Manhattan Bridge Overpass) and Brooklyn Navy Yard areas and is bordered at the southeast by Barclays Center. The strategic plan for the development of the Triangle into a center of technological innovation was formulated in 2013 and adhered to for several years after.
Along with the area, the entire borough developed into an epicenter of technology and innovation, with firms like Etsy, Kickstarter and Livestream headquartered there. A review of 36 Brooklyn based start-ups and tech companies, updated in January 2022, showed 17 located in DUMBO and three located in Downtown Brooklyn or the Brooklyn Navy Yard, and the remaining 16 located across the borough. These locations suggest that efforts to create innovation districts in Brooklyn were successful.34
Greater Downtown Brooklyn Area
In January 2020, a development boom consisting of a number of mixed-use and residential buildings was underway in Downtown Brooklyn. International firms were establishing a United States presence in the borough, and several public arts and performance projects were being planned. As with the rest of the City, Brooklyn’s cultural and entertainment amenities were closed through most of the shutdown period, and office sector workers have not returned to their offices at the same rate as prior to the pandemic.35
Brooklyn Navy Yard
In Brooklyn Navy Yard, an innovation district located in the Brooklyn Heights/Fort Greene neighborhood (as is Downtown Brooklyn and DUMBO), robotics and 3D printing company Nanotronics Imaging completed the conversion of a historic building into a 45,000-foot ‘smart’ factory (accommodating some 100 workers) in 2021. The project received financing from the City ($3.25 million) and the Regional Economic Development Council (REDC) ($2.25 million).
During the height of the pandemic in 2020, the Brooklyn Navy Yard Development Corporation coordinated a pivot by tenants to production of medical personal protective equipment (PPE). This response to the global shortage of PPE was facilitated by REDC funding of $31.6 million. The REDC reports that the effort resulted in 24 Navy Yard firms producing more than 25 percent of all locally produced PPEs (face masks, face shields, hospital gowns, hand sanitizers, protective partitions and 3D printed ventilator valves) used across the City to fight the pandemic.36
Brooklyn Army Terminal, Bush Terminal and Industry City
Businesses located in other innovation districts, such as the Brooklyn Army Terminal and Bush Terminal, also ramped up production of materials for COVID-19 response (such as ventilator parts). Other developments included the establishment of a life sciences laboratory, BioBAT (projected to cost $5.1 million), and more recent approval of REDC funding for expansion at that location.
MTA Enhancements
Since 2020, the Metropolitan Transportation Authority has undertaken accessibility improvements at three subway stations and a Long Island Rail Road (LIRR) station (see Figure 21). The three subway stations are among a list of 21 in Brooklyn for which work is planned in the MTA’s 2020-2024 capital program. Average ridership for these stations in 2019 was more than 18,600 per weekday and more than 23,100 per weekend.
FIGURE 21: MTA and LIRR Station Accessibility Improvement Projects Completed
| Station | Line | Date Completed |
Agency |
|---|---|---|---|
| Midwood/Ave H | Q | 11/2021 | MTA |
| 59th Street | N,R | 11/2020 | MTA |
| Brooklyn Museum | 2,3 | 12/2020 | MTA |
| Nostrand Ave/Atlantic Ave | LIRR | 10/2021 | LIRR |
Sources: Metropolitan Transportation Authority Press Releases
The MTA is also installing resilient systems and storm-surge flood protection at the Coney Island Yard Complex.37 Work completed under this project as of October 2021 included installation of communication and power cables and related equipment, and construction of almost half of the perimeter flood wall. The planned project completion date was changed from September 2022 to December 2022, and the budget was increased from $514 million to $520 million.38
Looking Ahead
Brooklyn is New York City’s largest and fastest growing borough and is home to an increasingly diverse and educated population. These trends laid a foundation for improvement in boroughwide socioeconomic indicators in the decade prior to the pandemic. However, there remain significant disparities in income, health and affordability between low-, moderate- and high-income neighborhoods in the borough that will need to be remedied if a recovery will lift households across the borough.
Despite these challenges, Brooklyn saw a faster job growth increase in the decade prior to the pandemic than any other borough, fueled by the leisure and hospitality sector. Given the pre-pandemic reliance on the sector for employment, the borough now trails the national employment recovery. However, in the year following spring of 2020, Brooklyn regained a larger percentage of jobs than citywide, led by the return of leisure and hospitality as well as by the construction and transportation and warehousing industries. As the recent Omicron variant of the COVID-19 virus recedes, job growth in these and other industries will improve.
Brooklyn also experienced less disruption on quality-of-life indicators such as crime and education while federal relief made its way to a greater share of businesses in low-income communities than citywide, providing a good foundation for regenerating employment among the borough’s small businesses.
Still, a return of employment may take some time, meaning that basic needs such as food and shelter may be more difficult to meet for some households, particularly in areas where disparities existed prior to the pandemic. While the City has implemented immediate measures to ensure individuals and families do not experience hunger and homelessness, it is likely that it will have to continue these efforts for some time.
As Brooklyn recovers, it will continue to attract innovative firms, jobs and people. It will be important for City and State officials to collaborate with business owners and community leaders to continue to maintain a welcoming business climate and effectively disseminate government resources to area businesses, individuals and families that still need these resources, to ensure an equitable recovery in the borough.
Endnotes
1 This count excludes institutions for rabbinical studies and the SUNY Downstate Hospitals and includes accredited institutions that offer an associate’s degree or higher.
2 Analysis of neighborhood and household level trends are based on U.S. Census Bureau American Community Survey (ACS) data. Since the 2020 ACS survey exercise was affected by the pandemic, the Bureau released experimental data products only for that year. Consequently, much of the household and neighborhood level trend analyses in this report cover periods that end with the year 2019.
3 See the U.S. Census Bureau discussion at https://www.census.gov/library/stories/2021/08/improved-race-ethnicity-measures-reveal-united-states-population-much-more-multiracial.html
4 The U.S. Census Bureau defines 55 neighborhoods citywide (with 18 in Brooklyn) called Public Use Microdata Areas (PUMAs), whose boundaries are similar to New York City community districts in all but four cases (two in the Bronx; two in Manhattan), where the PUMAs encompass two community districts each. Reference to neighborhoods throughout this document will be to one or more of these 55 Census defined areas.
5 Working residents included full-time and part-time employees as well as individual contractors, sole proprietors and self-employed individuals. Their place of business could be within or outside of the borough.
6 For the concepts of essential, face-to-face and remote industries, this report draws on two reports by James A. Parrot and Linda Moe at the Center for New York City Affairs: The New Strain of Inequality: The Economic Impact of Covid-19 in New York City, April 15, 2020; and The Covid-19 New York City Economy, Three Months In: Re-opening and a Continuing Low-Wage Workers Recession, June 2020.
7 All health-related data is from the NYC Department of Health and Mental Hygiene, unless otherwise specified.
8 Cases include both confirmed and probable cases. Cumulative rates are based on totals from the start of the pandemic, per 100,000 people.
9 Cumulative hospitalization rates at the neighborhood level are not published by the NYC Department of Health and Mental Hygiene as part of their COVID-19 data portal, although monthly rates are.
10 According to the NYC Department of Health and Mental Hygiene, someone is counted as fully vaccinated if they have had two doses of the Pfizer, Moderna or AstraZeneca “primary vaccine series” or one dose of the Johnson & Johnson/Janssen “primary vaccine series.”
11 The NYC Department of Health and Mental Hygiene notes that vaccination rates may exceed 100 percent of the estimated population, especially for small geographies, for reasons including use of 2019 population estimates for the calculations and some individuals’ use of a non-home address. Such rates are reported as 99 percent.
12 U.S. Census Bureau, American Community Survey, 1-year estimates.
13 Ridership levels for each month are measured by total turnstile entries as a share of total entries for the corresponding month of 2019 prior to the pandemic. See https://www.osc.state.ny.us/reports/osdc/impact-covid-19-pandemic-subway-ridership-new-york-city for more details.
14 Sarah Flood, Miriam King, Renae Rodgers, Steven Ruggles and J. Robert Warren. (2021). Integrated Public Use Microdata Series (IPUMS), Current Population Survey: Version 9.0 [dataset]. Minneapolis, MN. https://doi.org/10.18128/D030.V7.0
15 Princeton University. Eviction Lab. https://evictionlab.org/eviction-tracking/new-york-ny/, downloaded February 28, 2022.
16 See endnote 15.
17 New York State Office of Temporary & Disability Assistance, “New York State Emergency Rental Assistance Program", downloaded March 31, 2022, https://otda.ny.gov/programs/emergency-rental-assistance/program-reports.asp
18 U.S. Census Bureau, New York City Housing and Vacancy Survey, 2017.
19 New York State Homeowner Assistance Fund, https://www.nyhomeownerfund.org/reports, downloaded March 31, 2022.
20 See New York State and New York City Hunger Atlas and Annual Survey Report, Hunger Free America, 2021.
21 Calculated from responses to the annual Poverty Tracker survey, see Spotlight on Food Hardship in New York City: Lessons learned during the pandemic and where we go from here, Robin Hood Foundation, November 2021, https://www.robinhood.org/wp-content/themes/robinhood/images/poverty-tracker/pdfs/POVERTY_TRACKER_REPORT29.pdf.
22 Food Bank for New York City, Fighting More than COVID-19: Unmasking the State of Hunger in NYC During the Pandemic.
23 Spotlight on Food Hardship in New York City: Lessons learned during the pandemic and where we go from here, Robin Hood Foundation, November 2021, 6-7.
24 The City of New York, Feeding New York: The Plan to Keep Our City Fed During the COVID-19 Public Health Crisis, April 2021.
25 See report cited at endnote 23.
26 OSC, NYC Department of Education Response to the COVID-19 Pandemic, Report 8-2022, September 2021, at https://www.osc.state.ny.us/files/reports/osdc/pdf/report-8-2022.pdf
27 OSC, Availability, Access and Affordability: Understanding Broadband Challenges in New York State, September 2021, https://www.osc.state.ny.us/files/reports/pdf/broadband-availability.pdf.
28 U.S. Census Bureau American Community Survey, 1-year estimates.
29 Data on federal loans and grants in this section of the report draw on datasets and reports from the U.S. Small Business Administration.
30 For details on the 2020 round of lending, and legislative and policy changes made to the program, see OSC, The Paycheck Protection Program in New York City: What’s Next?, Report 10-2021, February 2021, https://www.osc.state.ny.us/files/reports/osdc/pdf/report-10-2021.pdf.
31 U.S. Small Business Administration, Disaster Assistance Update, Nationwide COVID EIDL. Targeted EIDL Advances, Supplemental Targeted Advances, March 24, 2022.
32 For more on distribution of federal resources across low- and moderate-income communities and historically underutilized business zones, see The New York City Restaurant, Retail and Recreation Sectors Still Face Uphill Recovery, OSC, Report 17-2022, January 2022, https://www.osc.state.ny.us/files/reports/osdc/pdf/report-17-2022.pdf.
33 Innovation districts are described by Sharon Zukin as ‘physical dense production districts comprised of research labs, business incubators for tech start-ups, coworking spaces, “creative” and corporate tech offices, and makerspaces for building and using computer hardware.’ Seeing like a city: how tech became urban. August 2020.
34 See list and description of the firms at https://www.builtinnyc.com/2017/03/17/brooklyn-startups-tech-companies-roundup
35 OSC, The Office Sector in New York City, Report 11-2022, October 2021, at https://www.osc.state.ny.us/files/reports/osdc/pdf/report-11-2022.pdf
36 State of the Region: New York City 2021 Annual Report. New York City Regional Economic Development Council, p. 18.
37 See meeting minutes, Capital Program Oversight Committee Meeting, Metropolitan Transportation Authority, October 18, 2021, https://new.mta.info/document/58806
38 See endnote 37.