

Resources and Responsibilities: New York State’s Environmental Funding
January 2021
Message from the Comptroller
On the founding Earth Day just over 50 years ago, New York State created the Department of Environmental Conservation (DEC) to ensure protection of our natural resources for generations to come. Since then, the State has made great strides to reduce pollution, protect wildlife, preserve open space and otherwise enhance the quality of our environment for all New Yorkers.
As DEC now enters its second half-century, its mission is broader than ever before. Wide-ranging laws to address climate change and major initiatives to assure clean drinking water are just some of the new tasks DEC has been assigned in the last few years, adding to an already long list of environmental planning, regulatory and management programs — all of which are important to our quality of life and the State’s economy.
It is not clear, however, how fully all these critical responsibilities can be addressed given the constraints on available resources. The State’s severe budget challenges, brought on by the COVID-19 pandemic, are likely to continue into the coming fiscal year and beyond. DEC spending through December of the current fiscal year, one of many areas where State spending has been curtailed, was down by more than $105 million from the previous year.
Over the decade ending in State Fiscal Year 2019-20, DEC’s annual capital spending rose by $342.9 million, allowing new investment in land acquisition, water infrastructure and other long-term assets. But spending from State Operating Funds, which pays for most of the agency’s regulatory and environmental management work, fell by $29.4 million, a reduction of 10 percent. Whether this decline has affected DEC’s ability to fulfill its expanding role is open to question.
Particularly in times of fiscal challenges, government must focus on top priorities and use taxpayer dollars efficiently and effectively. Clearly, New Yorkers have a vital interest in the protection and management of our environment. Intensifying fiscal pressures and an expanding mission require consideration of whether the DEC has the resources necessary to carry out its critically important functions. This report is intended to stimulate and inform such discussion and debate.
Thomas P. DiNapoli
State Comptroller
Executive Summary
Founded in 1970, the New York State Department of Environmental Conservation (DEC) is responsible for most of the State’s programs to protect wildlife, natural resources and environmental quality. More than five decades later, DEC programs range widely, from managing fish and game populations and overseeing the extraction of natural resources to monitoring the discharge of pollutants and hazardous materials and cleaning up contaminated sites.
The scope of the DEC’s mandate has expanded over the past decade, the period examined in this report, and will grow considerably further in coming years as a result of recent initiatives from the Legislature, the Executive and federal agencies. These include DEC’s responsibility for implementation of the State’s sweeping legislation to address climate change, including the Climate Leadership and Community Protection Act, the Climate Smart Communities Program and the Community Risk and Resiliency Act. Among other important new initiatives, DEC is also charged with overseeing $3.9 billion in appropriations in support of clean water infrastructure projects, and managing a variety of programs aimed at mitigating specific types of pollution.
DEC’s activities, both longstanding and new, are integral to New Yorkers’ health and to the State’s economy. While the agency’s responsibilities are increasing significantly, the adequacy of DEC’s resources to carry out its expanding portfolio is less clear.
All Funds spending by DEC rose by $218.9 million from State Fiscal Year (SFY) 2010-11 through 2019-20, an increase of 21.4 percent, or 5.1 percent after adjusting for inflation. The growth in overall DEC spending was driven by an increase of $342.9 million in capital disbursements, which included higher spending for important programs such as water infrastructure and the Environmental Protection Fund (EPF). State Operating Funds spending, by contrast, fell by $29.4 million, or 10 percent (a decline of 22.1 percent after inflation). Federal aid also fell, by nearly $94 million.
DEC’s State Operating Funds spending, supplemented with spending from federal funds, supports its environmental planning, management and regulatory oversight, work that will be essential to addressing climate change and fulfilling other new responsibilities. These resources flow primarily from the State’s tax revenues and fees for licenses and permits, and the decline in State operations spending over the past decade reflects reduced support from those sources. Given the State’s severe fiscal challenges and large projected budget gaps, it is unclear how DEC will balance its longstanding, essential responsibilities and important new functions within the limits of available resources.
New York has created a number of dedicated funds for environmental purposes in an effort to provide a reliable flow of resources to address long-term needs. At times, however, the State has resorted to sweeps from certain of these funds to provide budget relief.1 This has detracted from the intent of these funds.
Increased capital funding for environmental purposes over the past decade has made possible important new investments in land conservation, such as the 20,758 acre Boreas Pond Tract in the Adirondacks, as well as in grants to environmental justice groups and investments in water quality research. The State has made a significant commitment in support of water infrastructure through a cumulative total of $3.9 billion in appropriations from SFY 2015-16 through SFY 2020-21. Going forward, accomplishing such robust investment may be difficult, given the State’s fiscal outlook and competing capital needs. New York has a limited process in place to estimate and prioritize the level of capital investment needed for State and local government infrastructure. Establishment of a comprehensive process to better identify and prioritize capital needs could provide a clearer picture of whether current levels of investment for environmental purposes are sufficiently meeting such needs.
While spending and staffing levels have risen over the last 10 years, the DEC has also been taking on significant new responsibilities. These include addressing the State’s climate change mitigation efforts, while it continues to address growing water contamination problems resulting from hazardous waste sites, agricultural and non-agricultural non-point pollution and ongoing problems associated with sanitary waste treatment systems. The effort needed to address these issues is likely to grow in the coming years. A prudent and effective response to the challenges of paying for New York’s environmental needs may require multiple components, including improved efficiency and refined design of certain existing programs, as well as reconsideration of appropriate resource levels. This report, a follow-up to a 2014 report by the State Comptroller, is intended to assist State policy makers and the public in assessing these critical issues.
A Wide and Expanding Range of Responsibilities
The Department of Environmental Conservation (DEC) was created in 1970. Chapter 140 of the Laws of 1970 transferred the duties of the existing Conservation Department to the DEC, along with certain duties of the Department of Health and the Department of Agriculture and Markets. This statute combined most of the State’s programs to protect wildlife, natural resources and environmental quality into one State agency.
Today, the DEC implements a broad array of management and regulatory programs in New York State, including:
- Permitting and overseeing the operation of facilities that manage hazardous wastes, municipal wastes and sewage.
- Regulating discharges of pollution to State water bodies.
- Issuing air pollution permits, or registrations, for power plants, factories and other facilities such as dry cleaners that have the potential to emit air pollutants.
- Managing State wildlife populations and issuing licenses to hunt, trap and fish.
- Overseeing mining and oil and gas extraction in the State.
- Administering State-owned lands, boat launches and campsites in the Adirondack and Catskill Parks, and administering State reforestation lands, wildlife management lands and fishing access sites in the rest of the State.
- Conducting cleanups of contaminated sites under the State Superfund Program and monitoring cleanups undertaken through the State Environmental Restoration and Brownfield Cleanup Program.
- Assessing risks to the State’s environment related to climate change, and developing plans and programs to mitigate these risks.
DEC programs are integral to the functioning of society in New York State. Many businesses, while creating jobs and other economic benefits, also release pollutants into the State’s air, waterways and grounds. Municipalities must deal with wastes from residential, commercial and nonprofit-owned properties. The DEC is charged with implementing State and federal laws and regulations to manage and mitigate these hazards.
The DEC is also responsible for managing the extraction of natural resources to ensure that these activities do not damage the surrounding environment and, with regard to resources such as fish and wildlife, to ensure that populations can be sustained over time.
Among other responsibilities, as of 2020, the DEC regulates, remediates, administers and/or monitors:
- 21,933 permits under the State Pollutant Discharge Elimination System (SPDES), established to implement the federal Clean Water Act in New York.2
- 11,979 air pollution permits.3
- 5,337 contaminated sites under the New York State Superfund, Brownfield Cleanup, Environmental Restoration, and Voluntary Cleanup programs.4
- 10,965 spills of toxic substances between December 4, 2019 and December 4, 2020.5
- 37,483 active chemical and petroleum bulk storage facilities.6
- Over 300 State Forests comprising 800,000 acres.7
- 115 Wildlife Management Areas comprising 197,000 acres.8
- 2.9 million acres of forest preserve and 52 campgrounds in the Adirondack and Catskill Parks.
- 53 endangered species, 38 threatened species and 58 species of special concern.
- More than 100 game fish and game animal species.
- 12 fish hatcheries, raising 11 species of game fish and several endangered species, as well as the Richard E. Reynolds Game Farm which raises pheasants for release.
- Four summer youth camps and four environmental education centers.
While outside of the scope of this report, other agencies and authorities play significant roles and bring significant resources to bear in protecting the State’s environmental quality and natural resources. The Department of Parks, Recreation and Historic Preservation manages State parks and historic properties outside of the Adirondack and Catskill Parks, while the Department of Agriculture and Markets administers programs to assist farmers in limiting environmental impacts. The Department of Health evaluates public health risks from pollution and manages the State’s drinking water program.
The New York State Energy Research and Development Authority (NYSERDA), the New York Power Authority and the Long Island Power Authority operate programs to promote energy efficiency and support the development of renewable forms of energy.
In addition, NYSERDA operates programs to evaluate the technical performance of energy use and generation systems as well as the environmental impacts from the generation, transmission and use of energy in New York State.
Much of the funding for NYSERDA and the other authority work comes from off-budget sources, such as rates charged for electric service. For example, in SFY 2019-20, NYSERDA’s $1.5 billion in expenditures was supported in part by $739.1 million in utility surcharges, $546.3 million in revenues from the Clean Energy Standard, $108.6 million in proceeds from the Regional Greenhouse Gas Initiative, $34.6 million in State appropriations and other sources.9
The Environmental Facilities Corporation (EFC) administers the Clean Water State Revolving Fund and the Drinking Water State Revolving Fund (both funded through federal grants with a partial State match) in partnership with the Department of Environmental Conservation and the Department of Health. With this funding, EFC provides low- and no-interest financing and grants for clean water and drinking water infrastructure projects, among other functions. In SFY 2019-20, EFC received capitalization grants of $245 million and issued new debt of $460 million for the two revolving funds.10 Total revenue from all sources was $592 million in SFY 2019-20.11 EFC reports that from all its programs, it provided over $2.2 billion in low-cost financing and grants in SFY 2019-20.12
Just as the DEC’s success in fulfilling its mandates benefits individual New Yorkers as well as the State’s economy generally, so too any failure to meet its responsibilities would have broadly negative impacts. Obvious examples could include harm to public health, degradation of air and water quality, contamination of public and private lands and decline of wildlife populations. If sewage treatment facilities or hazardous waste disposal facilities are not operated and overseen properly, water sources might become unfit for drinking, recreational, business and industrial use.
New Yorkers have experienced wide-ranging consequences of such environmental crises both historically (such as at Love Canal in the 1970s and PCB discharges in the Hudson River) and more recently with water contamination in Hoosick Falls, Newburgh, Long Island and other locations.
Another example is the growing incidence of hazardous algal blooms occurring in water bodies across the state experiencing excess nutrient pollution. These events have forced municipalities to shut off water intakes serving public water supplies, and can shut down recreational and commercial uses of these waters until the bloom clears up.
Similarly, if air emissions from factories or power plants are excessive, the pollution may expose communities to higher risk of health impacts, including increased hospitalizations and mortality among sensitive populations from cancer, asthma and other diseases linked to environmental exposures. For example, it was discovered in early 2020 that a hazardous waste combustion facility in the Capital Region was burning perfluorinated compounds similar to substances that have raised serious concern for users of certain public water systems across the State. The discovery, at a DEC-regulated facility, led to legislation banning such burning at the Cohoes plant.
Failure to manage wildlife populations sustainably could lead to reductions in species that are important for recreational purposes, or that some New Yorkers rely upon as a source of sustenance, as well as a loss of biodiversity. Development projects requiring permits or approvals from the DEC risk being delayed if required agency approvals are not processed timely, potentially hampering job creation and economic growth. For all these reasons and many more, the DEC’s ability to meet its assigned responsibilities is critically important.
Recent Program Expansions
Over the course of the DEC’s history, new regulatory programs have been added to the agency’s list of responsibilities on an ongoing basis, and newly emerging environmental challenges have required attention. Often, new programs require the development of complex new regulations, involving the promulgation of numerical safety standards for exposure to toxic substances, or the regulation of hazardous industrial processes.
Most of these programs impose new regulatory responsibilities on the agency, such as issuing permits and conducting inspections to monitor adherence to requirements, as well as enforcement and compliance work with parties that violate regulatory standards or that fail to implement permit conditions. A partial listing of environmental challenges and regulatory initiatives that have required new or expanded action by the DEC since 2011 includes:
- Implementation of programs to mitigate climate change and promote resilient communities and infrastructure.
- Mitigation of pollution from peaking power plants.
- Reform of the Brownfield Cleanup Program.
- Reform of the Regional Greenhouse Gas Initiative.
- Development of measures to mitigate contamination of water sources by perfluorinated compounds.
- Response to growing threats from invasive species and hazardous algal blooms.
- Food donation and food scraps recycling.
- Water Infrastructure Improvement Act administration.
- Implementation of new requirements for collection, recycling and/or reuse of electronic equipment and mercury thermostats.
In certain cases, these additional responsibilities, which may involve substantial commitments of agency resources by DEC, have not been accompanied by additional staff or funding. Even when initiatives include funding provisions, such resources may not be adequate to fully cover required agency actions or maintain them over time.
A case in point: a recent audit by the Office of the State Comptroller found that Clean Air Act permitting fees charged by New York State were inadequate to fund the full costs of State regulatory programs as required by law. As of March 31, 2017, DEC’s Title V Operating Permit Program had an effective operating deficit of $70.7 million, including $50.4 million drawn from the agency’s General Fund appropriations in contravention of federal requirements.13
DEC Funding
Funding in support of DEC programs comes from appropriations from the State’s General Fund (primarily tax revenues), from special revenue funds generated by fees for licenses, permits and fines, and from the federal government. Appropriations approved in the State Budget reflect the legal authority to spend during any given State Fiscal Year. They provide an upper limit, or maximum, for spending on a designated program or purpose, while disbursements reflect the actual spending that occurred. Typically, the Division of the Budget (DOB) assigns the DEC and other agencies annual cash disbursement ceilings that are lower than the appropriated levels. DOB’s management of actual spending plays an especially critical role in the current fiscal year, given the authority it was granted in the SFY 2020-21 Enacted Budget to reduce spending in light of the State’s severe fiscal challenges.
Appropriations and Spending
Excluding reappropriations, All Funds (all appropriated State and federal funds) appropriations for the DEC were $1.0 billion in SFY 2010-11 and $1.8 billion in SFY 2019-20, an increase of approximately $756 million, or 75.4 percent. During this period, appropriations ranged from a high of $3.9 billion in SFY 2017-18 to a low of $899.0 million in SFY 2013-14. (The outsized appropriation level in SFY 2017-18 was largely due to a Capital Projects appropriation of $2.5 billion in water quality funds in that year.)
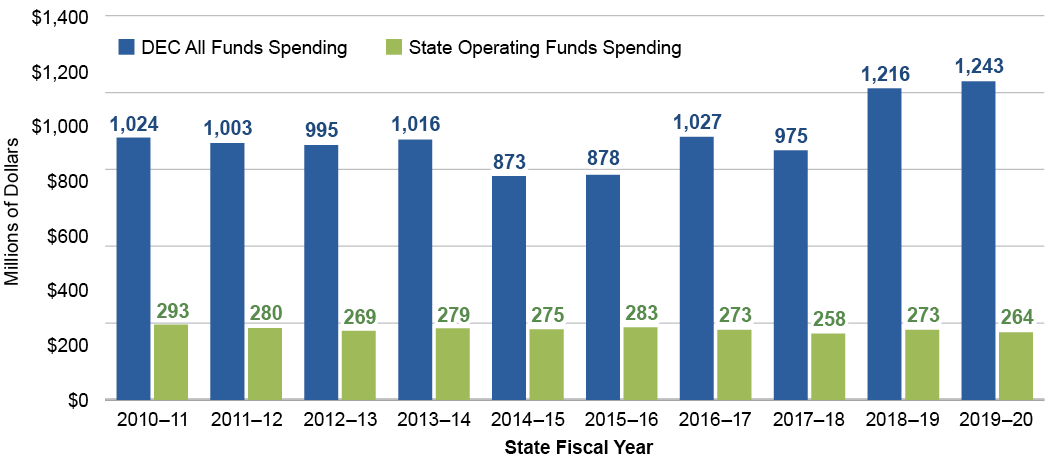
As shown in Figure 1, All Funds disbursements were $1.0 billion in SFY 2010-11 and approximately $1.2 billion in SFY 2019-20, for an increase of $218.9 million, or 21.4 percent.14 During the 10-year period, the highest spending level was reached in SFY 2019-20, while SFY 2014-15 represents the lowest spending level at $873.1 million. After adjusting for inflation, All Funds DEC spending rose by a cumulative 5.1 percent over the period examined.
FIGURE 1 - DEC All Funds and State Operating Funds Spending – SFY 2010-11 through SFY 2019-20
Source: New York State Division of the Budget
Spending by Funding Source
As noted earlier, spending on DEC programs comes from various State sources — the General Fund, Capital Projects funds, and Special Revenue funds — as well as federal funds. Figure 1 also shows the change in State Operating Funds (combining General Fund and State Special Revenue Funds) spending over the past decade.
DEC spending from State Operating Funds — which represents most of the agency’s spending from current State resources, rather than federal funding or borrowing — was $293.4 million in SFY 2010-11 and declined over the period examined to $263.9 million in SFY 2019-20 (excluding state operating spending for local assistance). This represents a decline of $29.4 million, or 10 percent.
Spending from the General Fund was nearly flat over the past decade, as shown in Figure 2. Such spending, primarily drawing on resources from the State’s tax revenues, rose slightly in nominal terms but declined by $8.6 million, or 8.1 percent over this period after adjusting for inflation.
DEC spending from State Special Revenue funds (primarily sourced from fees and fines) fell sharply after adjusting for inflation, by $57.2 million, or 30.1 percent, reflecting a decline of $36.6 million before such adjustment.
State Capital Projects Funds spending supports a wide variety of DEC initiatives, including climate change mitigation, open space, closure of municipal landfills, and storm water and wastewater projects. Such spending rose noticeably over the decade, with an increase of $342.9 million, or 93.6 percent, to reach $709.2 million in SFY 2019-20 (including grants to local governments). In part, this substantial increase is attributable to increased spending from the EPF and new spending from water infrastructure appropriations that began in SFY 2015-16.
Federal funds spending on DEC programs decreased by $93.9 million, or 26.0 percent, from $361.8 million in SFY 2010-11 to $267.8 million in SFY 2019-20. This decrease primarily reflects the spending down of funds from the federal American Recovery and Reinvestment Act (ARRA). In addition, in SFY 2010-11, a one-time $59 million in federal funding for Great Lakes restoration was appropriated in the DEC budget. Despite the decline over the period, federally funded spending was the second-largest among the four categories shown in SFY 2019-20, more than the combined State Operating Funds resources (General Fund and State Special Revenue funds).
FIGURE 2 - DEC Spending by Fund – SFY 2010-11 through SFY 2019-20
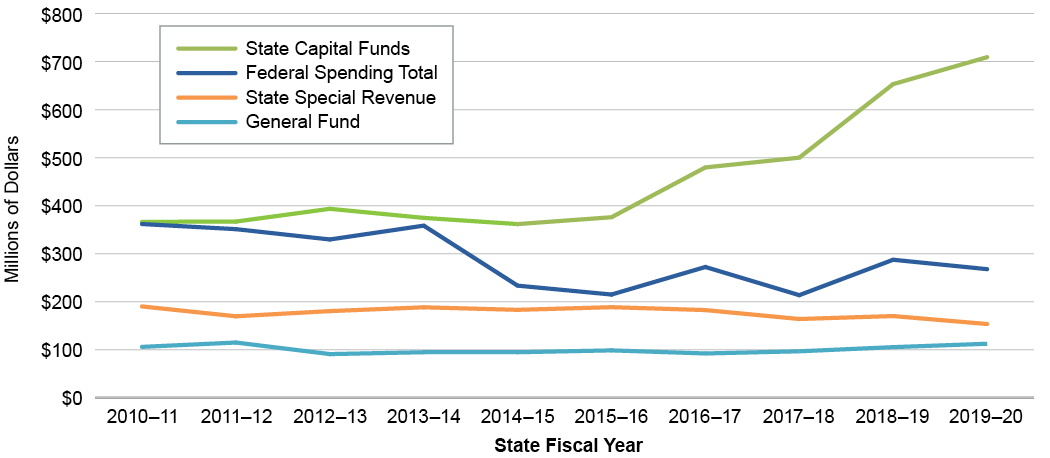
Source: New York State Division of the Budget
While the State Division of the Budget projects a DEC spending increase of 12 percent for SFY 2020-21, declining revenues from disruption of business activities and consumer spending associated with the COVID-19 pandemic are likely to impact spending across State programs and agencies. As of January 1, 2021, DEC reported disbursements for SFY 2020-21 of $571.9 million in the New York Statewide Financial System, a reduction of $105.2 million, or 15.5 percent, from disbursements reported on this date in SFY 2019-20.
Workforce
The size of the DEC workforce, as presented in the State’s Financial Plans and shown in Figure 3, has risen and fallen over the period examined, from 3,003 Full-Time Equivalents (FTEs) in SFY 2010-11, to a low of 2,869 FTEs in SFY 2014-15, to a high of 3,017 in SFY 2019-20. From the start to the end of this period, the net change was a marginal increase of 14 FTEs. As with the State’s overall workforce, DEC experienced significant staff reductions in the years immediately before the period analyzed in this report, resulting in a cumulative decline of 762 FTEs, or 20.2 percent, from SFY 2007-08 to SFY 2019-20. Its most recent reported FTE count reflects the ongoing impact of this workforce reduction.
FIGURE 3 - DEC Workforce – SFY 2010-11 through 2019-20
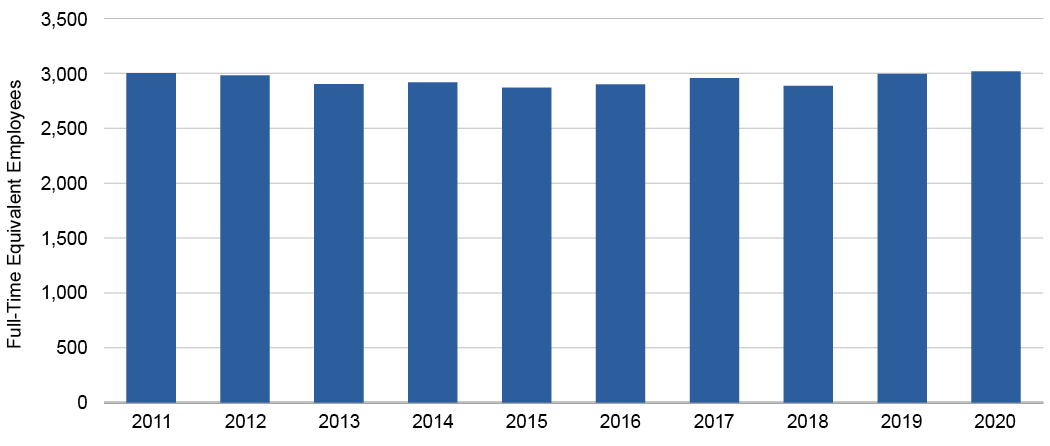
Source: New York State Division of the Budget
The fluctuations in DEC’s employment levels over the past decade were not proportional across the agency’s programs. For example, Air and Water Quality Management staffing fell by 59 FTEs, or 9.8 percent, and Solid and Hazardous Waste Management by 45 FTEs, or 7.9 percent.15 The Forest and Land Resources program experienced a more modest 6.2 percent increase.
Potential Impacts of Staff Changes on DEC Functions
As noted above, DEC staffing levels were hard hit in the years just before the period analyzed in this report and have fluctuated since, ending the 10-year period with a marginal agency-wide increase but with reductions in important programs, such as those mentioned above. Changes in employment levels in DEC programs may directly affect the agency’s ability to carry out the varied, essential elements of its mission. Two of the agency’s most critical and longstanding functions involve the implementation of the federal Clean Air Act and the Clean Water Act. A review of data that the DEC reported to the U.S. Environmental Protection Agency (EPA) for 2015 through 2019 highlights changes in program activity and performance over the period.16 In some cases, the data show declines in program activity that may be related to declines in staffing, while in other cases a relationship is unclear.
Clean Air Act
Clean Air Act compliance evaluations conducted by the DEC showed a slight decrease over the period, while declines in certain other areas were more significant. For example, the number of facilities undergoing on-site full compliance evaluations (FCEs) declined from 392 in 2015 to 319 in 2019. (EPA describes an FCE as a comprehensive evaluation of the compliance status of the facility. An FCE looks for all regulated pollutants at all regulated emission units, and it addresses the compliance status of each unit as well as the facility’s continuing ability to maintain compliance at each emission unit.17) In 2019, the DEC conducted FCEs at 9.6 percent of subject facilities, compared to a national average for state inspections of 35.5 percent of subject facilities. However, the number of stack tests reported by DEC increased by 27 from 2015 to 2019.18
Clean Water Act
During this period, some indicators of compliance with the Clean Water Act remained relatively stable while others showed reductions. The number of non-compliant facilities trended downward from 776 in 2015 to 748 in 2019, but the number of facilities with permit schedule violations increased from 821 in 2015 to 1,239 in 2019,19 while the number of facilities in significant non-compliance status declined slightly from 82 in 2015 to 76 in 2019. The number of facilities subject to DEC’s formal enforcement actions fell from 163 in 2015 to 129 in 2019, while DEC reported informal enforcement actions in only two years during this period, 98 in 2018 and 872 in 2019.
While there are many potential explanations for these changes in program activity and there are no uniform trends across all measures, staffing reductions in the Air and Water Quality Management Program may be a factor underlying declines in certain types of inspections and findings of environmental violations.
Major Dedicated Funds
The DEC supports several critically important environmental programs through funds that receive statutorily directed resources for specific purposes, also known as dedicated funds. Significant DEC-administered dedicated funds include the New York State Conservation Fund, the Hazardous Waste Remedial Fund and the Environmental Protection Fund. Funding patterns for these dedicated funds are highlighted below. The use of proceeds from voter-approved bond acts is also discussed in this section.
New York State Conservation Fund
The Conservation Fund, one of the State’s first dedicated funds, was created in 1925 to provide a stable, long-term source of revenue to help support activities related to the State’s fish, wildlife and marine resources. The Fund receives revenues from various sources, including all revenues from the sale of hunting, trapping and fishing licenses, which represent its largest source of funding. Other sources of funding for these programs include General Fund appropriations and federal funding associated with the Dingell-Johnson and Pittman-Robertson Acts.20
FIGURE 4 - Receipts, Disbursements and Fund Balance of the Conservation Fund
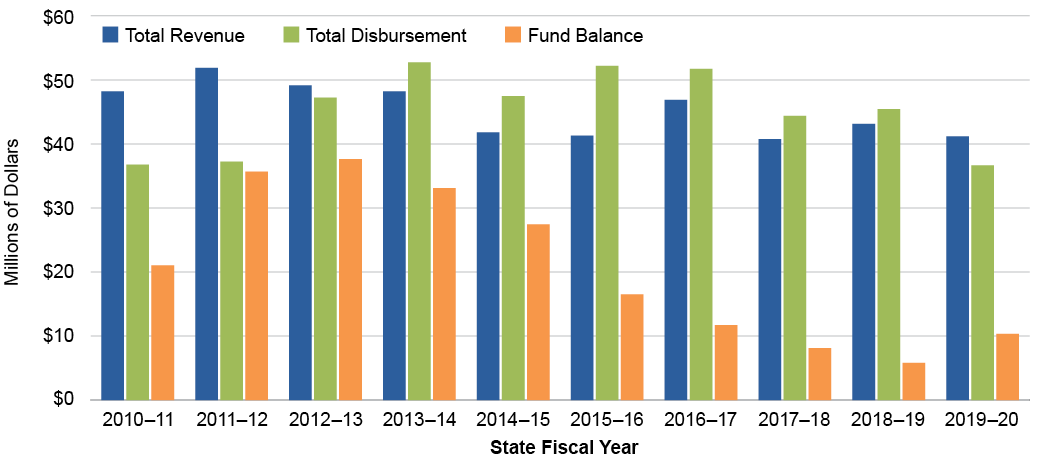
Source: Office of the New York State Comptroller
In SFY 2009-10, fees for hunting and fish licenses were increased by as much as 52.6 percent for certain licenses, increasing revenues derived from license fees. At the same time, disbursements from the fund declined, resulting in a climbing fund balance (see Figure 4). The reduction in disbursements is due in part to shifting expenditures for personal services associated with 117 environmental conservation officers (ECOs) from the Conservation Fund to the General Fund in SFY 2008-09.21
As Conservation Fund balances grew, ECOs began to be shifted back onto the Conservation Fund. In SFY 2013-14, fees for hunting licenses were reduced by 24.1 percent and fees for fishing licenses were reduced by 13.8 percent. This action reduced revenues and the balance in the Conservation Fund.22
Environmental Protection Fund
The Environmental Protection Act, Chapter 610 of the Laws of 1993, established the Environmental Protection Fund (EPF), a pay-as-you-go source of capital funding to support specified environmental programs and purposes. The Environmental Protection Act set aside sources of revenue to provide funding for the EPF, including: revenues from the Real Estate Transfer Tax; proceeds from the sale, lease or permitting of underwater State lands; and revenues from the issuance of conservation license plates for vehicles. Subsequent amendments to the Act added a portion of unclaimed bottle deposits and revenues derived from enforcement of the Bottle Bill.
Programs funded by the EPF include: open space conservation; nonhazardous landfill closure projects; municipal waste reduction and recycling projects; park, recreation and historic preservation projects; local waterfront revitalization projects; storm water, waste water and aquatic habitat restoration projects; agricultural nonpoint source pollution control; and farmland preservation.
Over the 27-year life of the EPF, $4.3 billion has been appropriated, $3.3 billion has been disbursed, $382.9 million is encumbered for projects and $668 million in appropriation authority is available for future obligations. Appropriations and disbursements from the EPF in recent years are shown in Figure 5. Appropriations in recent fiscal years have been $300 million annually and the SFY 2021-22 Executive Budget proposes a $300 million appropriation for the coming year. Disbursements in support of environmental projects from the EPF reached an all-time high of $249.6 million in SFY 2019-20.
In 2016 a new category of eligible projects, Climate Smart Communities (CSC) projects, was added to the EPF and grants in support of environmental justice projects were also authorized. Also in 2016, funding in support of Brownfields Opportunities Area (BOA) grants began to be appropriated in the EPF. Previously, CSC activities were funded off-budget by NYSERDA, and BOA grants were funded from appropriations from the Hazardous Waste Oversight and Assistance Account.
FIGURE 5 - Appropriations to and Disbursements from the Environmental Protection Fund by Fiscal Year End
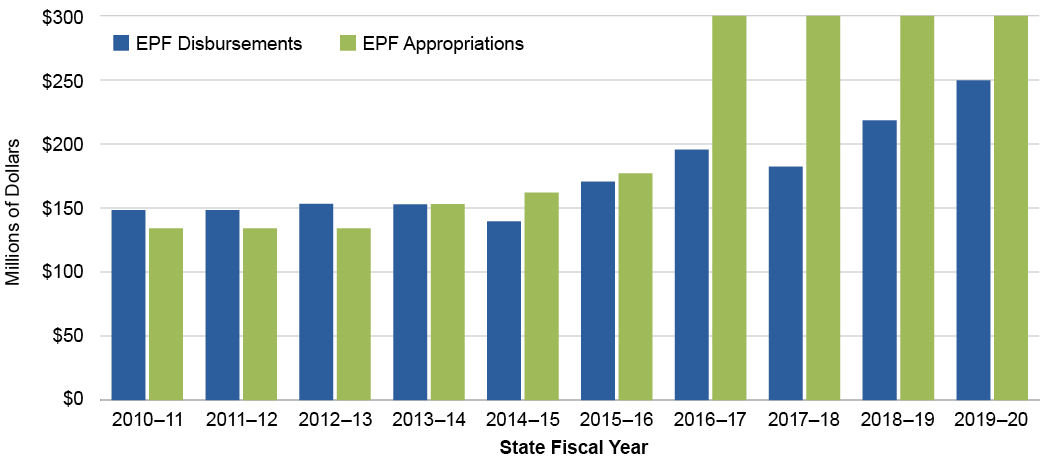
Source: Office of the New York State Comptroller
Pay-as-you-go spending from the EPF provides significant funding for environmental programs with current State resources. However, EPF funds have also been transferred (or “swept”) to the General Fund for State budget relief. In addition, over the life of the program, $306.5 million in public authority bonds have been issued to offset the impact of a portion of these sweeps, creating a debt service cost for repayment of principal and interest where one had not previously been envisioned.
Since the inception of the EPF, a total of $647.2 million has been swept from the EPF to the General Fund for State budget relief without being replaced by bonded funds, limiting funding available for environmental projects.23 In total, including funds swept to the General Fund and replaced with bond proceeds, $953.7 million in cash has been transferred out of the EPF.
Hazardous Waste Remedial Fund
The Hazardous Waste Remedial Fund was established by Chapter 857 of the Laws of 1982 to provide a source of funding to support State cleanups of hazardous waste sites conducted under the State Superfund program. Superfund spending for the period examined is shown in Figure 6. Revenues from penalties for illegal disposal of hazardous wastes and fees charged on the generation of hazardous wastes provided an initial source of financing.
The Environmental Quality Bond Act of 1986 allocated $1.2 billion in funding from authorized State general obligation bonds to the Fund. By 2000, a lack of funding had led to a reduction in the activities of the Superfund Program. Chapter 1 of the Laws of 2003, which enacted the State’s Brownfield Cleanup Program, provided a new source of financing for the Hazardous Waste Remedial Fund by authorizing the Environmental Facilities Corporation (EFC) to issue up to $120 million in State-supported bonds annually, up to a total of $1.2 billion. The EFC was prohibited from issuing bonds for new appropriations enacted after March 31, 2013. In 2015, amendments increased the bonding authorization to $2.2 billion, reduced the authorized annual issuance of bonds to $100 million, extended the authorization to appropriations enacted prior to March 31, 2026 and included environmental restoration program grants to municipalities among the authorized purposes. As of March 31, 2020 approximately $1.0 billion in bonding authority remained.24
FIGURE 6 - Annual State Superfund Disbursements
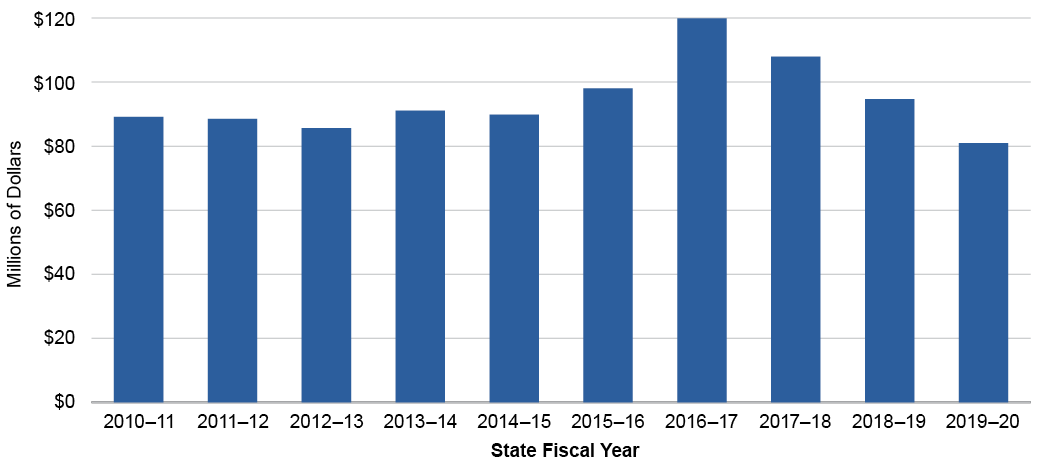
Source: Office of the New York State Comptroller
Voter-Approved Environmental Quality Bond Acts
Since 1960, New York State voters have approved seven general obligation (GO) bond acts, authorizing the issuance of nearly $5.7 billion in bonds, to finance a variety of environmental projects. As shown in Figure 7, approximately $185.5 million in bonding authority remains from these bond acts. Authorized projects have included park facilities, abatement of air and water pollution, solid waste management, remediation of contaminated sites and acquisition of recreationally or ecologically important lands.
FIGURE 7 - General Obligation Bonds Authorized and Issued Under Environmental Quality Bond Acts Since 1960 (Dollars in Thousands)
| Bond Act | Bonds Authorized | Bonds Issued | Authorized But Unissued | Bonds Outstanding |
| Clean Water/Clean Air Bond Act of 1996 | $1,750,000 | $1,643,368 | $106,632 | $344,745 |
| Air Quality | 230,000 | 202,063 | 27,937 | 1,795 |
| Safe Drinking Water | 355,000 | 355,000 | 0 | 0 |
| Clean Water | 790,000 | 733,130 | 56,870 | 288,411 |
| Solid Waste | 175,000 | 175,000 | 0 | 14,628 |
| Environmental Restoration | 200,000 | 178,175 | 21,825 | 39,911 |
| Environmental Quality Bond Act of 1986 | 1,450,000 | 1,409,601 | 40,399 | 89,556 |
| Land and Forests | 250,000 | 249,092 | 908 | 4,824 |
| Solid Waste Management | 1,200,000 | 1,160,509 | 39,491 | 84,732 |
| Environmental Quality Bond Act of 1972 | 1,150,000 | 1,132,447 | 17,553 | 10,574 |
| Air | 150,000 | 137,647 | 12,353 | 3 |
| Land and Wetlands | 350,000 | 347,132 | 2,868 | 4,915 |
| Water | 650,000 | 647,668 | 2,332 | 5,656 |
| Outdoor Recreation Development Bond Act of 1965 | 200,000 | 199,770 | 230 | 0 |
| Pure Waters Bond Act of 1965 | 1,000,000 | 980,076 | 19,924 | 13,651 |
| Park and Recreation Land Acquisition Bond Acts of 1960 and 1962 | 100,000 | 99,228 | 772 | 0 |
| TOTAL | $5,650,000 | $5,464,490 | $185,510 | $458,526 |
Source: Office of the New York State Comptroller
Note: Figure 7 reflects General Obligation environmental bond acts where there is a remaining authorized but unissued amount and/or remaining bonds outstanding. All amounts are current as of November 30, 2020.
While the Executive, the Legislature and the voters have approved bond acts for environmental purposes in each decade from the 1960s through the 1990s, no such proposals have been approved since 1996. In recent years, the State has relied on a combination of pay-as-you-go financing and State-supported bonds issued by its public authorities, commonly referred to as “backdoor borrowing,” to fund most of its capital investments for environmental and other purposes.
The SFY 2020-21 Enacted Budget included the $3 billion Restore Mother Nature general obligation bond act, subject to voter approval in the November 2020 General Election. However, in July 2020, the Director of the Division of the Budget employed provisions in the act that deferred its submission to the voters and repealed its proposed authorization. If the act had gone before the voters and been approved, it would have authorized State GO debt, including at least $1 billion for restoration and flood risk reduction, up to $700 million for climate change mitigation, up to $550 million for open space land conservation and recreation, at least $550 million for water quality improvement and resilient infrastructure, and $200 million to preserve, enhance, and restore natural resources and reduce the impact of climate change.
Water Infrastructure Improvement Appropriations
Since State Fiscal Year 2015-16, there have been five appropriations totaling $3.9 billion in support of certain water quality improvement projects.
The SFY 2015-16 Enacted Budget appropriated $200 million for municipal projects towards the replacement or repair of infrastructure.25 Portions of the appropriation were parceled out over three fiscal years, through SFY 2017-18. The last funding from this spending authorization was disbursed in SFY 2019-20.
The SFY 2016-17 Budget appropriated an additional $200 million for the same set of municipal projects. Of the appropriated funds, $100 million was made available in SFY 2016-17 and $100 million was made available in SFY 2017-18. As of the end of SFY 2019-20, $25 million of this appropriation had been disbursed.
In SFY 2017-18 an additional $2.5 billion was appropriated, allocating specific amounts to a much larger set of eligible projects, including:
- $150 million for State inter-municipal water infrastructure projects.
- $245 million for nonagricultural, nonpoint source control projects, municipal wastewater treatment projects, and municipal separate storm sewer system projects, as well as $25 million for proper management of road salt.
- $50 million for green infrastructure projects.
- $110 million for land acquisition for source water projection.
- $50 million for water quality protection projects related to concentrated animal feeding operations.
- $130 million for the remediation of contaminated sites.
- $20 million for replacement of lead drinking water service lines.
- $200 million for projects in the New York City watershed.
- $75 million to upgrade or replace septic systems and cesspools.
- $10 million for emergency assistance.
- $100 million for municipal water quality assistance programs that do not qualify for other State support.
- $10 million for information technology systems related to water quality.
Reappropriation language in the SFY 2018-19 Enacted Budget added eligibility for projects to clean up hazardous waste sites and allocated no more than $25 million for this purpose.
As of the close of SFY 2019-20, $194.7 million of funding authorized by the SFY 2017-18 appropriation had been disbursed.
The Enacted Budget for SFY 2019-20 included an additional appropriation of $500 million. As of the end of March 31, 2020, no funding from this appropriation had been disbursed. In addition, the Enacted Budget for SFY 2020-21 included a new appropriation of $500 million, bringing total appropriations to $3.9 billion for this purpose. A new appropriation of $500 million for water infrastructure is proposed in the SFY 2021-22 Executive Budget.
As of March 31, 2020, a total of $419.7 million of the cumulative appropriations had been disbursed. All of this funding has been reappropriated over the years, leaving approximately $3.5 billion in spending authority available for disbursement in support of eligible projects.
Conclusion
Over the 10-year period examined in this report, the DEC’s responsibilities have grown significantly, while its non-capital spending has declined and its staffing has remained relatively flat. While DOB has projected DEC spending will increase this fiscal year and in the next, the actual level of available resources is very much in question, given the State’s fiscal challenges and competing needs.
Certain indicators of DEC activity and performance in implementing federally mandated clean air and clean water programs appear to show declines in some activities; it is unclear whether such trends may be related to reductions in DEC staffing. In addition, disbursements of large appropriations in support of water infrastructure have been slow, which may also be attributable to reduced resources in this program. It is likely that the air and water quality programs will have a significant role to play in implementing the State’s response to climate change. Attention should also be paid to ensuring that these programs have the resources needed to undertake this new challenge while continuing to adequately ensure that the requirements of the Clean Air Act, the Clean Water Act and other baseline environmental quality protection programs are met effectively.
Capital spending on water treatment and protection, land acquisition and other programs is an integral part of DEC’s work. While such spending has risen in recent years, New York State has only a limited process in place to estimate and prioritize the levels of capital investment needed for State and local government infrastructure. Establishment of a more comprehensive, robust process to identify and prioritize capital needs could provide a clearer picture of whether current levels of investment in clean water, the cleanup of polluted sites and other environmental purposes are sufficiently meeting such needs.26 New Yorkers have a vital interest in the protection and management of our environment. Intensifying fiscal pressures and an expanding mission place a premium on effective and efficient use of DEC’s resources. In this context, this report illustrates the need for a thoughtful, wide-ranging discussion among policy makers and the public regarding the adequacy of the resources currently allocated to the DEC to carry out its critically important functions.
1 For example, $275 million was swept from the Environmental Protection Fund to the General Fund in SFY 2008-09. See Office of the State Comptroller, New York State’s Environmental Protection Fund: A Financial History, March 2018, available at https://www.osc.state.ny.us/files/reports/special-topics/pdf/environmental-protection-fund-2018.pdf.
2 SPDES Compliance and Enforcement Annual Report for SFY 2018/2019. Available at: https://www.dec.ny.gov/chemical/62557.html.
3 U.S. Environmental Protection Agency, Enforcement and Compliance History Online, at https://echo.epa.gov.
4 Environmental Site Remediation Database, at https://www.dec.ny.gov/cfmx/extapps/derexternal/haz/ results.cfm?pageid=3. Accessed on December 7, 2020
5 DEC Spill Incidents Database. Accessed on December 7, 2020, at https://www.dec.ny.gov/cfmx/extapps/derexternal/index.cfm?pageid=2.
6 DEC Bulk Storage Database. Accessed on December 7, 2020, at https://www.dec.ny.gov/cfmx/extapps/derexternal/index.cfm?pageid=4.
7 See www.dec.ny.gov/lands/40672.html.
8 See www.dec.ny.gov/outdoor/7768.html.
9 New York State Energy Research and Development Authority, Fiscal Year 2020-21 Budget and Financial Plan.
10 New York State Environmental Facilities Corporation (EFC), Annual Information Statement, October 1, 2020.
11 EFC, 2020-2021 Fiscal Year, Budget and Financial Plan.
12 EFC, Public Authorities Law Compliance Report, State Fiscal Year 2019 – 2020.
13 Office of the State Comptroller, “Title V Operating Permit Program Revenues, Expenditures, and Changes in Fund Balance for the Eight Fiscal Years Ended March 31, 2017” (Report 2020-F-13) (Follow-Up), at https://www.osc.state.ny.us/files/state-agencies/audits/pdf/sga-2020-20f13.pdf.
14 Data for historic spending and disbursements illustrated in Figures 1 through 3 originate from https://openbudget.ny.gov/spendingForm-classic.html.These figures illustrate disbursements as recorded by the New York State Division of the Budget.
15 DEC program level employment figures are drawn from the estimated FTEs for the current State Fiscal Year in the table titled “All Fund Types, Projected Levels of Employment by Program, Filled Annual Salaried Positions” in the Agency Presentations volume of the briefing materials distributed with the Executive Budget.
16 Data drawn from DEC reports to the U.S. EPA is reported on the Enforcement Compliance and History Online (ECHO) Analyze Trends: State Dashboards webpage at https://echo.epa.gov/trends/comparative-maps-dashboards/state-air-dashboard. 2019 was chosen to ensure that data was not affected by potential disruptions of activities due to the COVID-19 pandemic. Results are reported by federal fiscal year, which runs from October 1 of the prior year through September 30 of the named year.
17 See https://www.epa.gov/sites/production/files/2013-09/documents/cmspolicy.pdf, at page 6.
18 The U.S. EPA defines “stack test” as follows: A stack test, also referred to in EPA regulations as a performance or source test, measures the amount of a specific regulated pollutant, pollutants, or surrogates being emitted; demonstrates the capture efficiency of a capture system; or determines the destruction or removal efficiency of a control device used to reduce emissions at facilities subject to the requirements of the Clean Air Act. See https://www.epa.gov/sites/production/files/2013-09/documents/stacktesting_1.pdf.
19 Permit schedule violations occur when facilities that agreed to undertake a set of activities to remedy Clean Water Act non-compliance according to a set schedule fail to take the required actions on time.
20 The Federal Aid in Sport Fish Restoration Act of 1950 (Dingell-Johnson) and the Federal Aid in Wildlife Restoration Act of 1937 (Pittman-Robertson) provide for the apportionment to the states of revenues derived from excise taxes on fishing gear and hunting gear, respectively, to support the implementation of certain activities contained in an approved fish and wildlife management plan. To be eligible, states must pass laws for the conservation of fish and wildlife that include a prohibition against the diversion of funds for purposes other than the administration of state fish and wildlife programs. In addition to diversion of funds, other activities that are ineligible for program support are: enforcement of fish and game laws other than federal projects specifically authorized by the regional U.S. Fish and Wildlife Service Director; public relations activities other than those specifically related to federal projects; and activities like the sale of licenses that have the sole purpose of providing revenues.
21 New York State Office of the State Comptroller, Conservation Fund – Sources and Uses of Funds: Department of Environmental Conservation, State Audit Report 2012-S-134, October 2013, available at https://www.osc.state.ny.us/state-agencies/audits/2013/10/09/conservation-fund-sources-and-uses-funds.
22 Ibid.
23 DOB is authorized to repay up to $447.2 million of these funds if needed to meet the obligations of EPF programs.
24 See DOB data at https://www.budget.ny.gov/investor/bond/BondCapChart.html.
25 Chapter 60 of the Laws of 2015, Part G.
26 For more information, see the Office of the State Comptroller’s report on Strengthening New York’s Infrastructure: Spending Trends and Planning Challenges, August 2019, available at https://www.osc.state.ny.us/files/reports/special-topics/pdf/capital-report-2019.pdf.