This Google™ translation feature is provided for informational purposes only.
The New York State Office of the State Comptroller's website is provided in English. However, the "Google Translate" option may help you to read it in other languages.
Google Translate™ cannot translate all types of documents, and it may not give you an exact translation all the time. If you rely on information obtained from Google Translate™, you do so at your own risk.
The Office of the State Comptroller does not warrant, promise, assure or guarantee the accuracy of the translations provided. The State of New York, its officers, employees, and/or agents are not liable to you, or to third parties, for damages or losses of any kind arising out of, or in connection with, the use or performance of such information. These include, but are not limited to:
damages or losses caused by reliance upon the accuracy of any such information
damages incurred from the viewing, distributing, or copying of such materials
Because Google Translate™ is intellectual property owned by Google Inc., you must use Google Translate™ in accord with the Google license agreement, which includes potential liability for misuse: Google Terms of Service.
2023 Financial Condition Report For Fiscal Year Ended March 31, 2023
Major Local Revenue Sources Remain in Strong Condition
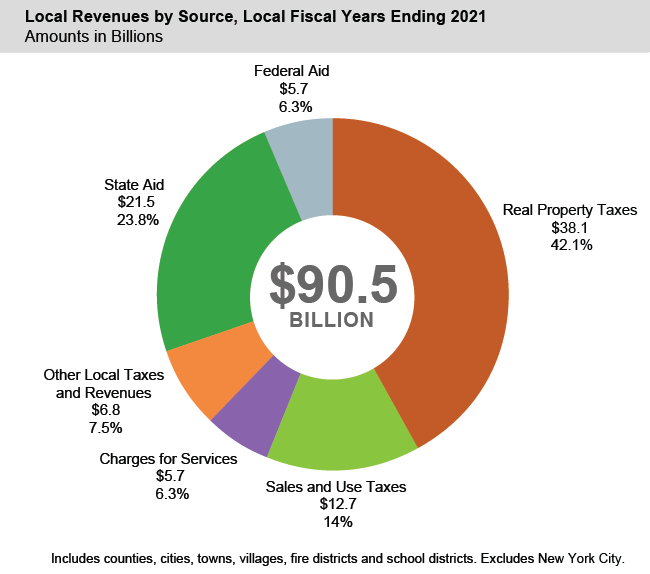
Real property tax revenues are the largest source of revenue for local governments. In local fiscal years ending (LFY) in 2021, property taxes accounted for $38.1 billion, or 42.1 percent, of total revenue ($90.5 billion) for local governments outside of New York City.
School districts, towns, and villages received $23.9 billion, $4.4 billion, and $1.5 billion, respectively, in real property taxes, representing around half of the total revenue for each class. Fire districts depend the most on property taxes, as they represented 89.5 percent ($870 million) of their total revenue; counties are least reliant at 21.5 percent ($6 billion).
State aid remained the second largest source of local government revenue in LFY 2021. School districts were the most dependent on State aid, as it represented 36.7 percent ($16.2 billion) of their total revenue. It also represents a significant share of revenue for other types of local governments – for social service programs in counties, to support highways (mostly in cities and towns), and as unrestricted municipal aid (mainly cities).
Sales and use taxes, the next largest source of revenue for local governments, experienced a significant rebound in LFY 2021, increasing by 18.8 percent over LFY 2020, when it was negatively impacted by the closure of nonessential businesses during the first wave of the COVID-19 pandemic. For counties, sales taxes remained the largest single revenue source, accounting for 36.6 percent ($10.3 billion) of their total revenue, followed by cities at 19.4 percent ($1 billion).
Property Tax – Inflation Far Outpaced Allowable Levy Growth
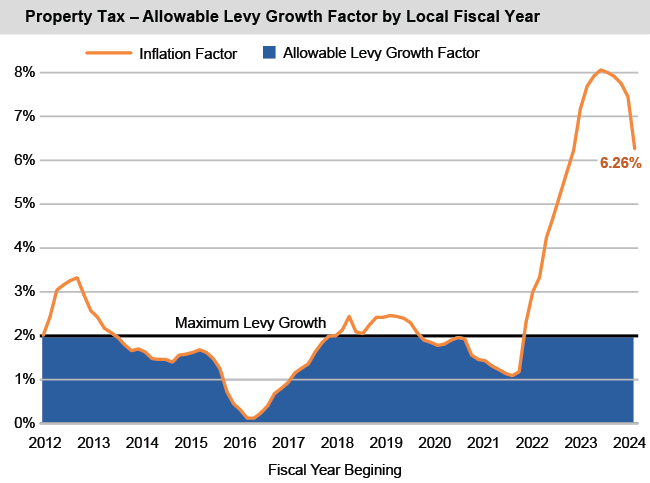
Generally, the property tax cap limits levy increases to the lesser of 2 percent or the rate of inflation, with some exceptions. However, each local government’s tax cap calculation involves a multi-step formula. The law also includes provisions for a local government to override the tax cap.
Inflation remained quite low, below 2 percent, during the first couple of years of the pandemic, which reduced the allowable levy growth factor to below 2 percent for nearly all local governments in local fiscal years beginning in 2020 and 2021. For fiscal years beginning in 2022, however, the inflation factor grew past 2 percent, and continued to increase throughout the year and into 2023, holding the allowable levy growth factor at its maximum value (2 percent) through the entire period.
The inflation factor for local governments with a calendar fiscal year in 2024 is 6.26 percent. The combination of high inflation and the 2 percent tax cap may create budgetary challenges for local governments.
Education and Employee Benefits Account for Nearly Half of Local Expenditures
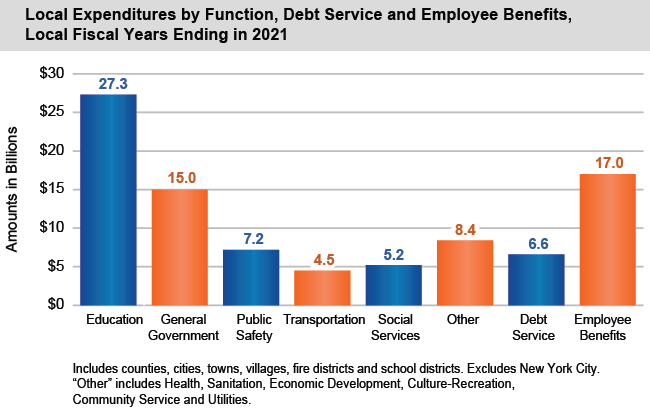
Local expenditures totaled $91.2 billion in LFY 2021. School districts spent the most at $45.6 billion, followed by counties ($26.8 billion), towns ($9 billion), cities ($5.5 billion), villages ($3.3 billion) and fire districts ($1 billion).
When looking at spending by function, education was the largest category at $27.3 billion or 29.9 percent of total expenditures in LFY 2021. Nearly all of this (95.8 percent) came from school district elementary and secondary education, with most of the rest being county expenditures on higher education. Education spending was down 0.1 percent in LFY 2021, largely due to continued pandemic-related changes to school district operations and the State temporarily withholding 20 percent of several school aid payments, requiring difficult budget management for school officials.
Employee benefits was the next largest area of expenditures in LFY 2021, accounting for $17 billion (18.6 percent) of total spending, an increase of 2.4 percent compared to LFY 2020. In fact, employee benefits have been the fastest growing expenditure historically, increasing at an average annual rate of 2.6 percent from LFYs 2011 to 2021, higher than the rate of growth in total expenditures at 1.8 percent.
Fiscal Stress Was Relatively Low in LFY 2021
The Office of the New York State Comptroller analyzes the financial condition of counties, cities, towns, villages and school districts through its Fiscal Stress Monitoring System (FSMS), which combines several financial indicators into an overall score intended to measure each entity’s budgetary solvency.
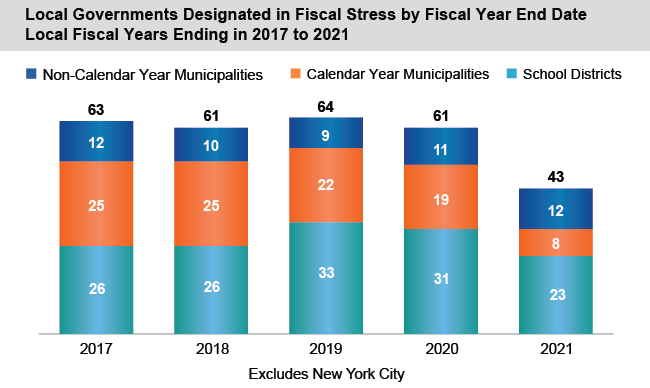
Overall fiscal stress levels decreased in LFY 2021 compared to LFY 2020. A total of 43 local governments, including 23 school districts, were in some fiscal stress designation in LFY 2021, resulting in 18 fewer local governments than in LFY 2020. This marked the lowest number of local governments in a fiscal stress designation since FSMS was implemented in 2013.
The number of calendar year municipalities (all counties, towns, most cities and a few villages) designated in fiscal stress dropped from 19 in LFY 2020 to 8 in LFY 2021, while the number of non-calendar year ones (some cities and most villages) slightly increased over the same period, from 11 to 12. Separately, school districts saw a significant decrease in stress designations – from 31 in LFY 2020 to 23 in LFY 2021.
Much of the drop in fiscal stress in LFY 2021 was related to the impact of responses to the pandemic. The decline was most noticeable among calendar year municipalities, who received the first of two American Rescue Plan Act (ARPA) federal aid lump sum payments in the summer of 2021. (The distribution of 2021 ARPA payments affected LFY 2022 for most non-calendar year municipalities.) Many calendar year municipalities also benefitted from the robust recovery of local sales tax revenues during the fiscal year. The number of school districts in stress also declined, but mostly because many of them had made budget cuts in response to fiscal uncertainty early in the 2020-21 school year.
A total of 188 municipalities failed to file their annual financial reports in time to receive a fiscal stress score in LFY 2021. This was the highest rate of non-filers since FSMS began in 2013. (School districts typically do not have issues filing in time to receive a score.)