

New York’s Balance of Payments in the Federal Budget
Federal Fiscal Year 2019
Message from the Comptroller
November 2020

In the wake of the COVID-19 pandemic, New Yorkers have seen how the immense fiscal resources of the federal government can help everyday Americans in times of real need. Unfortunately, we have also seen how myths and misrepresentations in Washington can prevent the full and appropriate use of those resources to respond to a national emergency.
This report, the fifth in a series by the Office of the State Comptroller, makes clear how the 50 states differ in what they pay in federal taxes and how much they receive in federal spending. For New York, the numbers vary from year to year, but one key conclusion does not: the Empire State’s taxpayers consistently send billions of dollars more to Washington than we receive back from the federal government.
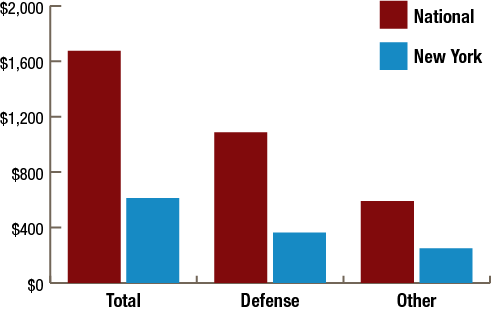
In Federal Fiscal Year (FFY) 2019, New York State generated $23.7 billion more in federal taxes than it received in federal spending. In total dollars, New York’s deficit was the highest among the 50 states. For every tax dollar paid to Washington, our State received 91 cents in return—well below the national average of $1.24.
As in past years, the imbalance largely reflects New York’s comparatively high federal tax payments. The State generated over $265 billion or 8.1 percent of the $3.3 trillion in federal tax receipts. By contrast, the $241 billion in federal spending the State received represented 5.9 percent of the nationwide total, the same as New York’s share of the U.S. population.
Federal funding makes up more than one in every three dollars in New York State’s budget. Stimulus and relief funding that Washington has provided in response to the coronavirus pandemic has been a financial lifeline for millions of New Yorkers, helping families across the State put food on the table and cover other essentials, and providing vitally important support for many thousands of businesses and nonprofit organizations.
Yet the federal response remains incomplete. The State, its local governments, the Metropolitan Transportation Authority and other governmental entities will be forced to cut essential services, raise taxes and fees, and/or resort to borrowing that imposes costs on future generations to close today’s gaps if Washington does not provide the additional aid that is so badly needed.
The late Daniel Patrick Moynihan pioneered the concept of this balance of payments report when he represented New York in the United States Senate, and we are proud to carry on his work. Moynihan believed that making the facts clear about how the federal budget distributes money among the states could help produce a more equitable outcome for all Americans. At a time when a global pandemic has inflicted severe damage to both public health and the economy, I hope this report contributes to a more fruitful debate over the next steps in Washington’s response.
Thomas P. DiNapoli
State Comptroller
Table of Contents
The Balance of Payments Between the Federal Government and the States
Revenues Paid to the Federal Government
Federal Spending in the States
Assessing New York State’s Balance of Payments
Executive Summary
The budget of the United States government plays a major role in the finances of New York State and its local governments, as well as in the daily lives of New Yorkers. Such has been the case for decades, long before the COVID-19 pandemic devastated the economy and decimated tax revenues. Federal spending provides Social Security income, Medicare and Medicaid health coverage and other benefits for millions of State residents. Federal aid represents more than one in three dollars in the State Budget. Spending from Washington also supports tens of thousands of New York jobs. Meanwhile, the Empire State generated over $265 billion in federal tax revenues in the 2019 fiscal year.
The fiscal relationships between Washington and the 50 states vary widely, both overall and within particular budgetary areas. This report examines the flow of funds between the federal government and the states for the Federal Fiscal Year (FFY) ending September 30, 2019, with special attention to its impact on New York State. The analysis is based on data from federal budget documents, the Internal Revenue Service and other sources.
Based on federal receipts and outlays analyzed for this report, in FFY 2019, New York State generated $23.7 billion more in taxes paid to the federal government than it received in return through federal spending. Because New York’s share of federal revenues generated was among the highest of any state’s while the federal spending it received was close to the average, its net balance of payments was more negative than most. New York contributed $13,626 per capita in tax revenue to the federal budget, over one-third more than the national average. The State received an estimated $12,407 in per capita federal spending.
In other words, for every dollar New York generated in federal tax receipts, it received 91 cents back in federal spending—compared to a national average of $1.24. New York’s per capita deficit of $1,219 in its balance of payments ranked 49th among the states.
While the period examined in this report predates COVID-19, its findings provide further evidence to support repeated calls by Comptroller DiNapoli and others for robust federal support for New York in response to the pandemic. The gap between taxes paid and spending received in New York varies from year to year, but has remained consistently negative in analyses of five federal fiscal years by the Office of the State Comptroller, ranging from $19.9 billion in FFY 2013 to $40.9 billion in FFY 2016.
The year-to-year changes result from a variety of factors. In FFY 2019, overall federal spending rose more rapidly than federal receipts, contributing to the improvement in the balance of payments for most states. In New York, federal spending rose 6.2 percent compared to 7.0 percent nationally. While overall federal tax payments from most states also rose, receipts from New York grew modestly more than the national rate, or 4.4 percent compared to 4.0 percent.
The largest of the broad spending categories in the federal budget represents direct payments to or for individuals for a variety of programs such as Social Security, Medicare, benefits for veterans and retired federal employees, and food assistance. Spending for such direct payments totaled $2.5 trillion nationwide in FFY 2019. New York received an estimated $148.1 billion in this category, with a per capita figure that was close to the national average. Major programs for which the State received higher-than-average per capita expenditures include Medicare, food assistance and Supplemental Security Income (SSI). Payments from Washington for federal employee retirement benefits and veterans’ benefits to New York were lower than average on a per capita basis.
In the second largest spending category in the federal budget, grants to state and local governments, New York received $73.4 billion and fared better than 48 states on a per capita basis. Medicaid makes up more than half of all federal spending for such grants, and New York’s per capita Medicaid funding from Washington ranked second among the states.
In two other major categories—procurement and federal employee compensation—federal spending in New York was less than half of the national average on a per capita basis. The State’s combined total in these two areas, $19.9 billion, was 2.4 percent of the nationwide total.
Overall, New York State received 5.9 percent of total federal spending examined for this analysis, marginally less than the 6.0 percent received in the prior year. The State generated 8.1 percent of total federal tax revenue examined for this report, which was higher than its shares of the U.S. population (5.9 percent) and of the nation’s personal income (7.5 percent). On a per capita basis, federal tax revenues from New York State were more than a third higher than the national average, partly because of taxpayers’ relatively higher incomes. Overall federal income tax receipts in the 2018 federal tax year (the same as calendar 2018) declined, as did those paid by New Yorkers, due to the Tax Cuts and Jobs Act (TCJA) that was enacted at the end of 2017. Due to certain timing and economic factors, that was not the case for the federal fiscal year analyzed in this report.
The federal budget deficit in FFY 2019, $984 billion, represented current spending that was funded by borrowing. As a result, federal spending in the states was greater than federal revenue raised—the states, in the aggregate, received more than they paid.
Federal budget deficits (or surpluses) change over time, depending on many factors including shifts in the economy as well as policy actions that affect levels of spending and revenues. The federal deficit is expected to increase in coming years, primarily due to federal stimulus and relief enacted in response to the COVID-19 pandemic but also because of the TCJA enacted in December 2017 and certain spending changes enacted separately by Congress.
Federal spending and the burden of federal taxes are not apportioned to the states according to any single formula. Rather, dozens of statutory provisions as well as a wide range of economic, demographic and political factors drive the state-by-state distribution of such costs and benefits. Examples of such factors include: each state’s population; its number of residents in poverty or eligible for Social Security, Medicare and Medicaid; income levels; and the state’s own policy choices. The 2020 Census may affect New York’s and other states’ balance of payments, in both the near and longer terms, as updated population counts influence the state-by-state allocation of funding in certain programs, as well as the size of each state’s Congressional delegation.
Leaders in Washington continue to debate the federal government’s role in responding to the public health and economic crises brought on by the coronavirus pandemic. As this report makes clear, states do not share equally in federal spending, nor in generating federal tax receipts. The data presented here is intended to help New Yorkers better understand how federal budget policies affect the State, and to promote the State’s interests in the nation’s fiscal debates going forward.
Introduction
This report examines the flow of funds between the federal government and the 50 states for the Federal Fiscal Year ending September 30, 2019.1 The study includes three major parts:
- Identification of tax revenues paid to the federal government from each of the states and of dollars spent by the federal government in each state, also referred to as expenditures received by each state. Federal spending includes: direct payments to or for individuals (for example, Social Security and Medicare); grants to state and local governments (for Medicaid and other programs); procurement of military equipment and other goods and services; and wages and salaries for federal government employees.
- Analysis of these revenue and expenditure flows to determine the balance of payments—that is, the difference between revenues and expenditures—on the national level and in each of the 50 states.
- Review of specific elements of federal revenues and expenditures to identify how the composition of New York’s balance of payments differs from other states.
In FFY 2019, the federal government spent more than $4.4 trillion, and brought in $3.5 trillion in revenue, with a budget deficit of $984 billion. For the purposes of this analysis, as in previous reports by the Office of the State Comptroller, certain revenue and spending amounts were excluded, resulting in an allocation of $4.1 trillion in expenditures and almost $3.3 trillion in tax revenues that are relevant and practical to allocate to the states. Almost 95 percent of federal receipts and 92 percent of federal outlays are allocated by state in this report.2 A summary of the methodology used for this report can be found in Appendix B.
All figures in this report derive from compilation and analysis by the Office of the State Comptroller of data from the U.S. Office of Management and Budget, the U.S. Census Bureau, the U.S. Internal Revenue Service, other federal agencies, the Federal Procurement Data System, USAspending.gov and Federal Funds Information for States, unless otherwise noted.
The Balance of Payments Between the Federal Government and the States
Most states received substantially more in federal expenditures than they generated in federal revenues in FFY 2019. Nationwide the average gain was $2,426 per capita. In other words, U.S. residents on average “received” that much more in federal expenditures than they “paid” in federal taxes.
This was not the case for New York. Unlike most states, New York’s balance of payments with Washington was negative.
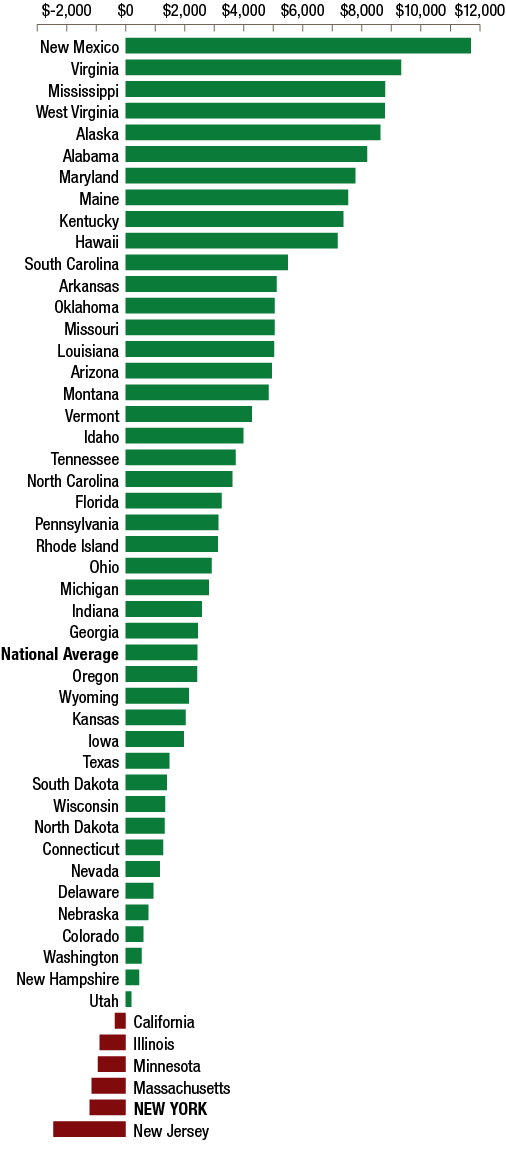
New York’s per capita contribution to the federal treasury was $13,626, exceeding the national average of $10,005 by 36.2 percent. New York received $12,407 in per capita federal spending, slightly below the national average of $12,431. Thus, for every dollar New York generated in federal tax receipts, it received 91 cents back in federal spending—compared to a national average of $1.24. The combination of federal tax payments and federal expenditures resulted in a $1,219 per capita deficit for the Empire State, a ranking of 49th in the nation. Overall, 44 states had a positive balance of payments with the federal government, and six—including New York—had a negative balance, as shown in Figures 1 and 2.
FIGURE 1 - Per Capita Balance of Payments Between the Federal Government and the States, FFY 2019
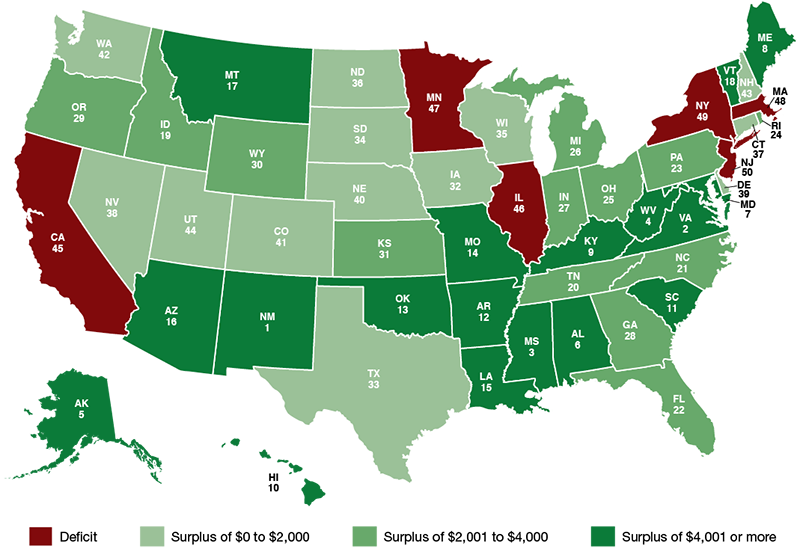
Note: The numbers shown in the map reflect each state’s ranking in per capita balance of payments for FFY 2019, from most favorable (1) to least favorable (50).
Two of New York’s neighboring states—New Jersey and Massachusetts—also had a negative balance of payments; on a per capita basis, New Jersey experienced the largest deficit. Seven of the 10 states with the largest positive balances of payments were in the southern or southwestern regions. New Mexico fared the best, with a per capita surplus of $11,695.
On the basis of total dollars rather than dollars per capita, New York’s ranking was last among the states (the largest imbalance in dollar terms), with a total deficit of $23.7 billion. Virginia experienced the largest surplus in total dollars, followed by Florida. (Figures for all states appear in Appendix A.)3
The Office of the State Comptroller has released four previous analyses of New York State’s balance of payments in the federal budget. These reports estimated balance of payments deficits of $19.9 billion in FFY 2013, $40.9 billion in FFY 2016, $24.1 billion in FFY 2017 and $26.6 billion in FFY 2018.
The improvement in New York’s FFY 2019 balance of payments deficit of almost $3 billion reflected a $14.2 billion increase in federal spending in the State, which more than offset an increase of $11.2 billion in taxes paid by New Yorkers, compared to 2018. The overall federal deficit increased by over $205 billion compared to FFY 2018. The following sections describe these changes in more detail.
FIGURE 2 - Per Capita Balance of Payments Between the Federal Government and the States, FFY 2019
Note: Specific figures appear in Appendix A.
Revenues Paid to the Federal Government
In 2019, all revenues paid to the federal government totaled $3.5 trillion. This figure primarily represents revenue from the following taxes, as classified by the federal Office of Management and Budget: personal or individual income tax; social insurance taxes and contributions; corporate income tax; excise taxes; and estate and gift taxes. For the 50 states and Washington, D.C., collections from these taxes generated a total of $3.3 trillion or $10,005 per capita in FFY 2019. A breakdown of all revenues in FFY 2019 is shown in Figure 3.
FIGURE 3 - Federal Revenues in FFY 2019: $3.5 trillion
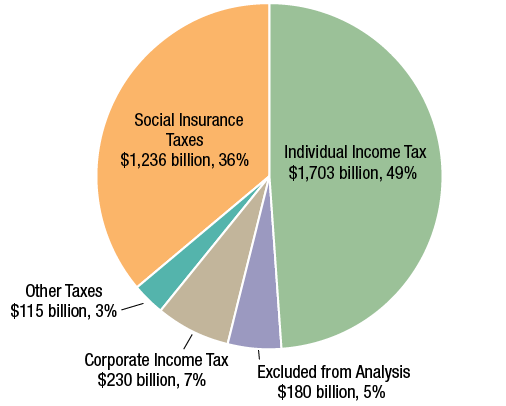
Note: See next page for revenues included in Social Insurance Taxes. Other taxes include excise taxes, which are primarily imposed on production, sale or consumption of fuel, tobacco and alcohol products, among others; as well as estate and gift taxes. “Excluded from Analysis” represents miscellaneous receipts and customs duties and fees, along with revenues from Puerto Rico and other outlying areas.
New York generated 8.1 percent of the $3.3 trillion in federal tax payments, while the State represented 5.9 percent of the nation’s population in 2019. At $13,626, New York’s per capita contribution to the federal treasury was third highest among the states and 36.2 percent more than the national average, as illustrated in Figure 4.
Connecticut had the highest per capita contribution to the federal treasury at $14,907, followed by Massachusetts with $14,345. Mississippi generated the lowest per capita total tax payments at $5,848. New York’s total payments of over $265 billion ranked third among the states behind California and Texas.
FIGURE 4 - Per Capita Taxes Paid to the Federal Government, FFY 2019
Note: Specific figures appear in Appendix A.
FIGURE 5 - Federal Taxes Paid: New York and Nation, FFY 2019
| 50 States | New York | |||||
| Total (millions) | Per Capita | Total (millions) | Share of 50 States | Per Capita | Rank (per capita) | |
| Total (Taxes Paid) | $3,284,050 | $10,005 | $265,075 | 8.1% | $13,626 | 3 |
| Individual Income | $1,702,722 | $5,187 | $151,870 | 8.9% | $7,807 | 3 |
| Social Insurance | $1,235,690 | $3,765 | $87,667 | 7.1% | $4,506 | 6 |
| Corporate Income | $230,245 | $701 | $19,407 | 8.4% | $998 | 2 |
| Excise | $99,321 | $303 | $4,448 | 4.5% | $229 | 50 |
| Estate and Gift | $16,072 | $49 | $1,684 | 10.5% | $87 | 3 |
Individual Income Taxes
Individual income taxes made up $1.703 trillion, or 49 percent of all revenues paid to the federal government in FFY 2019. New York’s payments of almost $152 billion represented 8.9 percent of total federal receipts from individual income taxes. Total payments from New York rose 2.4 percent compared to a national increase of 1.5 percent.4
New York’s per capita individual income tax payments of $7,807 were more than 50 percent higher than the national average of $5,187. New York ranked third among the states in this category, with Connecticut first at $8,734. A breakdown of New York’s per capita tax payments relative to those made by other states, and to the national average, is shown in Figure 5.
Social Insurance Taxes and Contributions
The second largest component of total taxes is payments for social insurance taxes and contributions.5 These totaled $1.236 trillion and accounted for 36 percent of total federal revenues. New Yorkers’ payments of $87.7 billion were 7.1 percent of the total federal receipts from social insurance taxes.
New York’s per capita contribution for such payments, $4,506, was 19.7 percent above the national average of $3,765, ranking it sixth among all states in this category. New Jersey made the highest per capita social insurance payments at $4,964, while Mississippi made the lowest at $2,729.
Corporate Income Tax and Other Taxes
Corporate income taxes made up 6.6 percent of total federal receipts in FFY 2019. An estimated 8.4 percent of this $230 billion total came from New York. Per capita corporate income taxes for New York were $998, which was $296 higher than the national per capita level of $701, placing New York second highest among the states.
Delaware paid the most per capita in corporate income taxes, at $1,014, followed by New York and Connecticut. New Mexico’s per capita corporate tax payments were the lowest among all states.
Other federal taxes include excise taxes on fuel, tobacco and alcohol, and estate and gift taxes. Approximately 4.5 percent of federal excise taxes, and 10.5 percent of federal estate and gift tax receipts, were from New York State. At $229 per capita, New York’s overall contribution for federal excise taxes was the lowest of all the states on a per capita basis. Wyoming paid the most in per capita excise taxes, more than twice New York’s amount.
By contrast, New York’s per capita estate and gift tax payment of $87 was well over the national average of $49. It ranked third in this measure, while Wyoming ranked first.
Federal Spending in the States
In 2019, the federal government spent over $4.4 trillion, including $4.1 trillion in expenditures that could be allocated among the states.6 A breakdown of overall FFY 2019 federal spending is shown in Figure 6.
FIGURE 6 - Federal Spending in FFY 2019: $4.4 trillion
Note: Veterans’ service-connected compensation is included with Veterans Benefits, not Employee Retirement. The Food Stamp program was renamed the Supplemental Nutrition Assistance Program (SNAP) in 2008. “Excluded from Analysis” consists primarily of undistributed offsetting receipts, net interest on the federal government debt, and overseas procurement, along with expenditures in Puerto Rico and other outlying areas. Percentages may not add to 100 due to rounding.
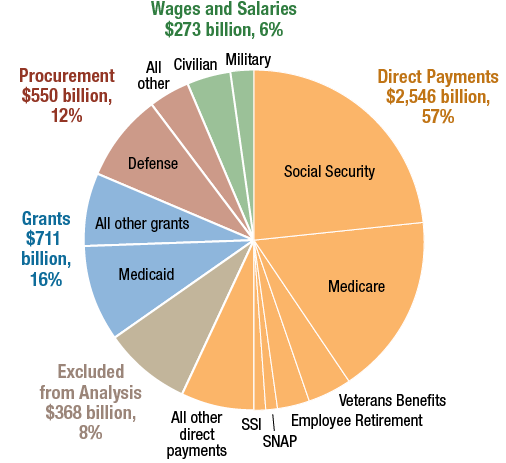
By far the largest category of federal expenditures is direct payments to or on behalf of individuals, which totaled over $2.5 trillion or more than 62 percent of federal spending allocated to the states in FFY 2019. Social Security and Medicare represented approximately 71 percent of these direct payments in FFY 2019.
The second largest federal spending category was grants to state and local governments. Medicaid made up over 57 percent of the $711 billion in such expenditures. Procurement was the third largest category, at $550 billion, while the fourth largest category, federal employee wages and salaries, totaled more than $273 billion.
FIGURE 7 - Per Capita Federal Expenditures, FFY 2019
Note: Specific figures appear in Appendix A.
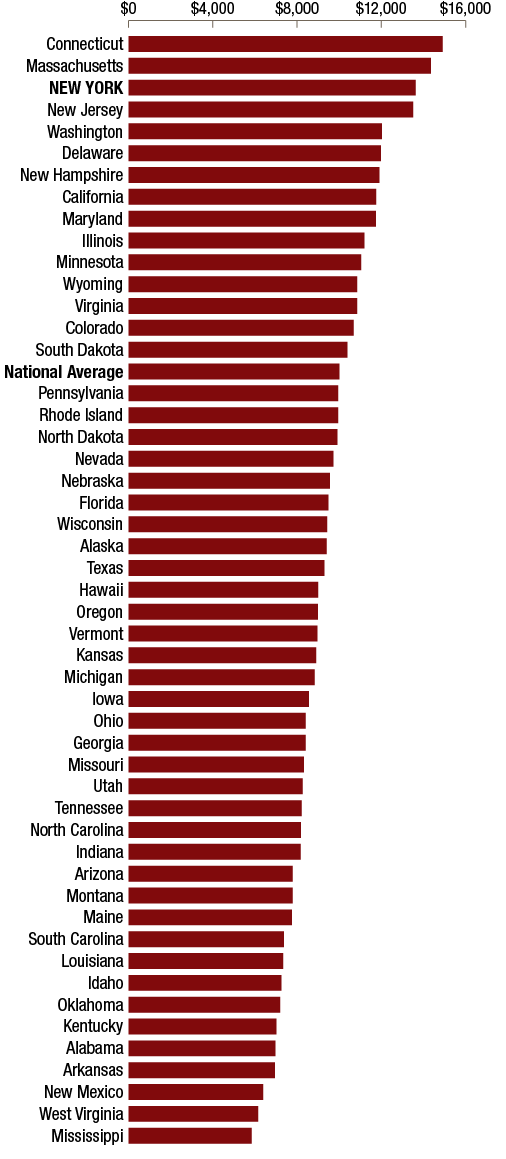
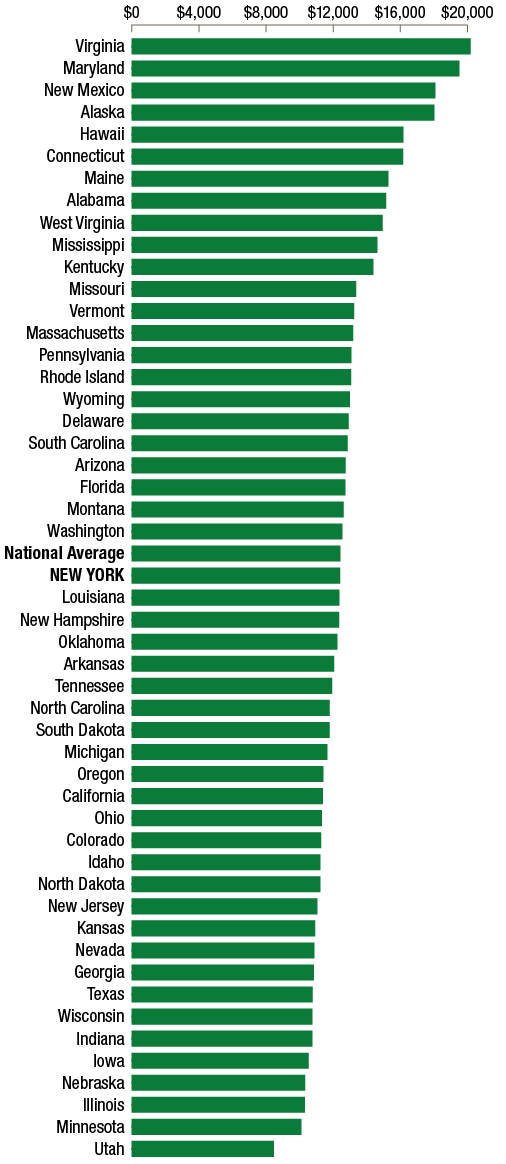
As the recipient of $12,407 in per capita federal spending, New York ranked in the mid-range (24th) among the states, as illustrated in Figures 7 and 8. This amount was close to the national figure of $12,431 per capita.
New York’s 5.9 percent share of total federal spending was the same as its share of the national population.
Virginia and Maryland ranked first and second among the states as the recipients of per capita federal expenditures of $20,181 and $19,524, or 62 and 57 percent higher than the nationwide average, respectively, primarily because of significantly higher-than-average procurement spending and wages and salaries.
Per capita federal spending of $8,462 in Utah was the lowest in the country, 32 percent below the national average. Utah ranked last among the states in direct payments and grants, on a per capita basis.
FIGURE 8 - Federal Spending by Major Category: New York and Nation, FFY 2019
| 50 States | New York | |||||
| Total (millions) | Per Capita | Total (millions) | Share of 50 States | Per Capita | Rank (per capita) | |
| Total | $4,080,452 | $12,431 | $241,369 | 5.9% | $12,407 | 24 |
| Direct Payments | $2,545,562 | $7,755 | $148,062 | 5.8% | $7,611 | 34 |
| Grants | $711,299 | $2,167 | $73,449 | 10.3% | $3,776 | 2 |
| Procurement | $550,129 | $1,676 | $11,900 | 2.2% | $612 | 44 |
| Wages and Salaries | $273,462 | $833 | $7,958 | 2.9% | $409 | 42 |
Direct Payments
As noted earlier, direct payments to or for individuals accounted for the largest component of federal government expenditures in the states—62.4 percent in 2019. The total spent in New York was $148.1 billion, or 5.8 percent of the nationwide total, placing New York fourth highest for direct payments behind California, Texas and Florida.
Overall, in this category, per capita federal expenditures were similar in New York and nationwide, with New York’s figure of $7,611 per capita at 1.9 percent below the national average. A breakdown of federal direct payment expenditures by major category in New York and nationally is shown in Figure 9. West Virginia, Maine and Florida received the highest per capita direct payments, while Utah received the lowest, followed by Texas.
FIGURE 9 - Federal Direct Payment Expenditures: New York and Nation, FFY 2019
| 50 States | New York | |||||
| Total (millions) | Per Capita | Total (millions) | Share of 50 States | Per Capita | Rank (per capita) | |
| Total | $2,545,562 | $7,755 | $148,062 | 5.8% | $7,611 | 34 |
| Social Security | $1,028,922 | $3,135 | $61,836 | 6.0% | $3,179 | 34 |
| Medicare | $774,169 | $2,359 | $50,863 | 6.6% | $2,615 | 12 |
| Veterans Benefits Programs | $189,786 | $578 | $6,658 | 3.5% | $342 | 49 |
| Federal Employee Retirement | $147,665 | $450 | $3,637 | 2.5% | $187 | 50 |
| Supplemental Nutrition Assistance Program (SNAP) |
$56,218 | $171 | $4,398 | 7.8% | $226 | 6 |
| Refundable Earned Income Tax Credit | $59,167 | $180 | $3,476 | 5.9% | $179 | 19 |
| Supplemental Security Income (SSI) | $55,948 | $170 | $4,393 | 7.9% | $226 | 7 |
| All Other | $233,687 | $712 | $12,800 | 5.5% | $658 | 35 |
Social Security
Social Security payments represented the largest component—over 40 percent—of direct payments to or for individuals. The three major Social Security programs providing benefits to the aged, the disabled and their survivors totaled approximately $1.03 trillion in 2019, more than the combined federal spending for grants and wages and salaries.
Per capita Social Security payments to New York were $3,179, about the same as the national average of $3,135. As with other per capita figures, this amount represents total Social Security payments divided by the state population, not average Social Security benefits per recipient. Differences among the states in per capita payments received for Social Security and other benefit programs reflect a mix of factors, including the proportion of the population eligible for benefits and the amount of benefits received by individual recipients, which may vary based on numerous criteria.
West Virginia received the highest per capita Social Security payments at $4,236, which was 35 percent more than the national average. Utah received the lowest per capita payments in the country at $2,154, which was 31 percent below the national average.
Medicare
Nationwide expenditures for all Medicare programs totaled over $774 billion in FFY 2019.
With $2,615 in per capita Medicare payments, New York received almost 11 percent more than the national average of $2,359 and ranked 12th among the states for such federal spending.
Florida received the highest per capita Medicare payments at $3,020, which was 28 percent higher than the national average. Utah and Alaska ranked lowest in this category at 42.4 and nearly 40 percent below the national average, respectively.
Retirement Payments and Veterans Benefits
In FFY 2019, New York ranked the lowest of any state in receiving retirement payments to former federal civilian and military employees, and 49th for a range of veterans benefits.7
Nationwide, retirement payments to former federal workers made up 5.8 percent of direct payments, $147.7 billion, in FFY 2019. (Wages and salaries for current employees are reported in a separate category, as detailed later in this report.) In this category, per capita payments to New York were $187, less than half the national average of $450. Such per capita spending was highest in Maryland and Virginia, each of which received over three times the national per capita figure.
At $189.8 billion, veterans benefits represented 7.5 percent of direct payments nationwide. For New York, per capita benefits were $342, which is 40.8 percent less than the national average of $578 per capita. New Jersey, at $271, was the only state that received less per capita than New York in this category. By contrast, Alaska and West Virginia received per capita spending in this category that was significantly more than the national average, at 92.6 percent and 69.2 percent respectively.
FIGURE 10 - Major Safety Net Spending, New York and National Average, FFY 2019
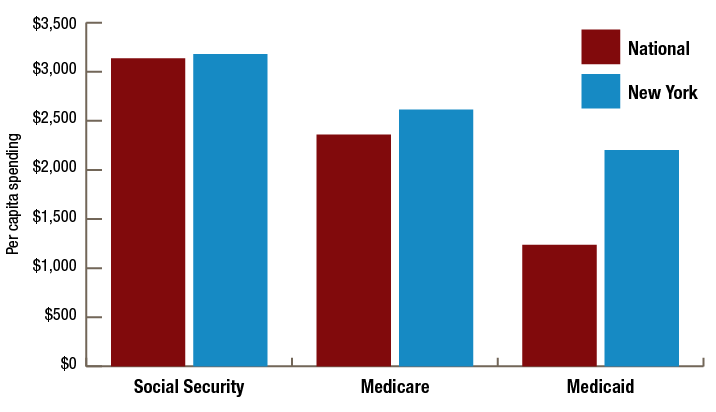
Social Security, Medicare and Medicaid are, by far, the three largest elements of the federal government’s “safety net” expenditures. Figure 10 shows per capita spending on these programs in New York and nationally. Social Security paid $61.8 billion to New Yorkers in FFY 2019, more than any other individual federal program, with per capita payments modestly higher than the national average. Medicare payments received in the State totaled close to $50.9 billion, and expenditures per capita in this category were 10.9 percent above the national average. The Medicaid program delivered almost $42.9 billion to New York in FFY 2019, with per capita expenditures 78 percent above the national average. (Medicaid is discussed in more detail below, in the section titled Grants.)
Grants
The federal government provided more than $711 billion in grants to state and local governments in FFY 2019. Medicaid was by far the largest grant program, representing 57.1 percent of this total. Spending on transportation was second largest, at 9.1 percent. Dozens of other grant programs that provide funding for services such as nutrition, housing, education, and family and children’s services make up the remainder of this category. New York ranked second among the states in per capita federal grants, at $3,776, or 74.2 percent above the national average, largely because of Medicaid and other safety net grants, which are discussed below. Figure 11 provides a breakdown of federal grant payments in New York and nationally.
FIGURE 11 - Federal Grants to State and Local Governments: New York and Nation, FFY 2019
| 50 States | New York | |||||
| Total (millions) | Per Capita | Total (millions) | Share of 50 States | Per Capita | Rank (per capita) | |
| Total | $711,299 | $2,167 | $73,449 | 10.3% | $3,776 | 2 |
| Medicaid | $406,411 | $1,238 | $42,863 | 10.5% | $2,203 | 2 |
| Transportation | $65,076 | $198 | $4,259 | 6.5% | $219 | 22 |
| Education | $41,797 | $127 | $2,935 | 7.0% | $151 | 12 |
| Other Safety Net | $136,643 | $416 | $18,252 | 13.4% | $938 | 1 |
| All Other | $61,372 | $187 | $5,140 | 8.4% | $264 | 5 |
The other four states in the top five for per capita federal grants all had much smaller populations than New York. These were Alaska, New Mexico, Vermont and West Virginia, with Alaska ranked above New York. Utah, Florida and Nebraska received the lowest per capita grant expenditures among the 50 states.
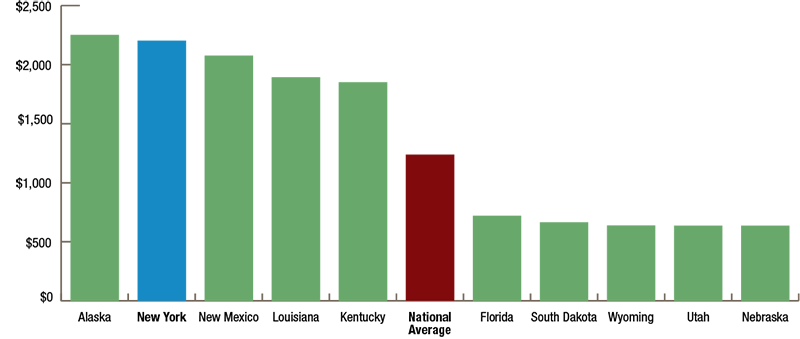
Medicaid
In FFY 2019, federal government spending on Medicaid in the 50 states was $406.4 billion. New York received close to $42.9 billion or $2,203 per capita, 78 percent more than the national average of $1,238, ranking it second among the states. Alaska received the most per capita at $2,251, almost 82 percent above the average. Such funding is based partly on the Federal Medical Assistance Percentage (FMAP), the level at which the federal government reimburses certain state Medicaid expenditures. FMAP is higher in states with relatively low per capita personal incomes and lower in states with higher personal incomes; both Alaska and New York have higher per capita incomes than most states and their FMAPs are at the lowest level, 50 percent.
However, the overall level of Medicaid funding received by states from the federal government also reflects other factors. Among others, these include: the number of beneficiaries (New York has a higher proportion of its population enrolled in the program than most states); the breadth of benefits the state makes available (New York offers a wider range of benefits than most states); the costs of providing care (wages and certain other costs are generally higher in New York than in many other states); and special agreements called waivers in which the federal government may provide additional aid. Figure 12 shows the states with the highest and the lowest federal Medicaid spending per capita in FFY 2019.
FIGURE 12 - Per Capita Federal Medicaid Spending, Highest and Lowest Five States, FFY 2019
Aid for Transportation
Federal aid for transportation—highways, mass transit and airports—was the second largest grant category with $65.1 billion spent in FFY 2019. Federal spending on highways and mass transit is largely funded by the Highway Trust Fund, which raised $43.9 billion, primarily from the motor fuel tax, in FFY 2018.
Highway Trust Fund moneys are used both for highway and transit projects. Fund expenditures are distributed to states based on factors including lane miles and vehicle miles traveled, estimated fuel tax payments by highway users, and mass transit usage.
As shown in Figure 13, New York’s combined transportation grants were $219 per capita, above the national average of $198. The State ranked 46th in the nation for per capita federal highway funding ($96) but first for transit funding ($87). The federal government also provided more modest aid for airports. New York received $7 per capita in such funding. New York received $29 per capita in smaller grants administered by the Department of Transportation and ranked midway among the states for such spending.
FIGURE 13 - Federal Transportation Grants: New York and Nation, FFY 2019
| 50 States | New York | |||||
| Total (millions) | Per Capita | Total (millions) | Share of 50 States | Per Capita | Rank (per capita) | |
| Total | $65,076 | $198 | $4,259 | 6.5% | $219 | 22 |
| Highways | $42,775 | $130 | $1,858 | 4.3% | $96 | 46 |
| Transit | $10,417 | $32 | $1,700 | 16.3% | $87 | 1 |
| Airports | $3,254 | $10 | $136 | 4.2% | $7 | 39 |
| All Other | $8,629 | $26 | $565 | 6.5% | $29 | 22 |
Aid for Education
The federal government spent $41.8 billion in FFY 2019 for elementary and secondary education for disadvantaged students (Elementary and Secondary Education Act or ESEA, Title 1), special education, education improvement programs and other purposes such as vocational rehabilitation and career education. As shown in Figure 14, New York received 7 percent of the total expenditures for these programs and ranked 12th as a recipient of overall per capita education spending.
Federal per capita spending for ESEA Title 1 in New York, at $63 per person, was 32.3 percent higher than the national average, placing New York fifth among all states.
Federal aid to New York for special education was modestly above the national average on a per capita basis ($44 compared to $39).
FIGURE 14 - Federal Education Grants: New York and Nation, FFY 2019
| 50 States | New York | |||||
| Total (millions) | Per Capita | Total (millions) | Share of 50 States | Per Capita | Rank (per capita) | |
| Total | $41,797 | $127 | $2,935 | 7.0% | $151 | 12 |
| ESEA Title I | $15,737 | $48 | $1,234 | 7.8% | $63 | 5 |
| Special Education | $12,805 | $39 | $854 | 6.7% | $44 | 16 |
| Education Improvement | $4,485 | $14 | $317 | 7.1% | $16 | 19 |
| All Other | $8,770 | $27 | $530 | 6.0% | $27 | 25 |
Other Safety Net Spending
New York receives significant levels of grant funding for a range of safety net programs apart from the federal government’s spending for Medicaid.8 Overall, the federal government spent more than $136 billion in FFY 2019 for child nutrition, housing and heating, cash assistance and work supports, children’s and others’ health, and child and family services such as Head Start.
For these programs collectively, New York received 13.4 percent of national expenditures, as shown in Figure 15. Per capita spending for the State in this category, $938, was more than twice the national average of $416 and ranked New York first for such spending. New York was followed by Massachusetts, California and Rhode Island, while per capita spending was the lowest in Utah and Idaho.
FIGURE 15 - Federal Safety Net Grant Spending Other Than Medicaid: New York and Nation, FFY 2019
| 50 States | New York | |||||
| Total (millions) | Per Capita | Total (millions) | Share of 50 States | Per Capita | Rank (per capita) | |
| Total | $136,643 | $416 | $18,252 | 13.4% | $938 | 1 |
| Housing | $28,149 | $86 | $4,271 | 15.2% | $220 | 1 |
| Child Nutrition | $23,063 | $70 | $1,491 | 6.5% | $77 | 14 |
| Children's Health Insurance | $17,484 | $53 | $1,500 | 8.6% | $77 | 9 |
| TANF | $19,521 | $59 | $3,121 | 16.0% | $160 | 1 |
| Child and Family Services | $10,871 | $33 | $734 | 6.7% | $38 | 19 |
| Basic Health Plan | $5,298 | $16 | $4,838 | 91.3% | $249 | 1 |
| All Other | $32,257 | $98 | $2,299 | 7.1% | $118 | 5 |
Within this category, federal expenditures for housing and the Temporary Assistance for Needy Families (TANF) block grant program represented 35 percent of total spending. New York received more than 15 percent of national spending for each of these program areas and experienced the highest per capita expenditures among the states for housing and TANF, at $220 and $160, respectively. These amounts were more than double the national averages.
The Affordable Care Act authorizes states to establish a Basic Health Program (known in New York as the Essential Plan), a low-cost health insurance option for individuals who meet certain income and other requirements. In 2015, New York joined Minnesota as one of only two states in the nation to establish such a program. This program has provided an important source of federal aid to New York. New York’s share of nationwide funding in this area for FFY 2019 was almost 91.3 percent of the total, or $4.8 billion. Minnesota received the remainder of the funding.
For the $23 billion Child Nutrition category that includes programs such as School Breakfast and School Lunch, New York received per capita payments modestly above the national average ($77 compared to $70).
FIGURE 16 - Per Capita Federal Procurement Spending, FFY 2019
Procurement
The federal government spent an estimated $550.1 billion in FFY 2019 to purchase services and goods in the 50 states and Washington, D.C.9 The Department of Defense was the source of almost 65 percent of such procurement spending. The departments of Energy, Veterans Affairs, and Health and Human Services were the next largest sources of such federal procurement spending.
With $612 in per capita procurement spending overall, 36.5 percent of the national average, New York ranked 44th among the states, as shown in Figure 16. Department of Defense procurement spending was $363 per person in New York, compared to a national average of $1,086. Virginia received the highest total procurement spending from the federal government at $62.2 billion, and the highest per capita amount for procurement at $7,290, followed by Maryland at $5,947.
Wages and Salaries
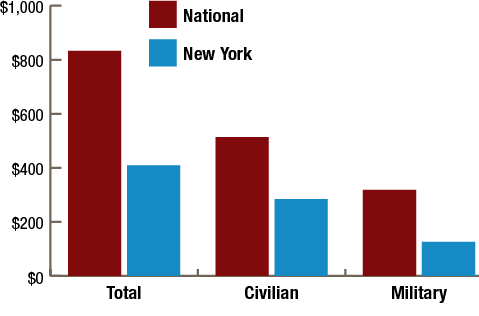
Spending on federal employee wages and salaries throughout the nation totaled $273.5 billion, for a per capita national average of $833 in FFY 2019.10 Federal government spending on civilian pay was $168.7 billion, or 62 percent of the total, and spending on military salaries was $104.8 billion, or 38 percent.
In New York, just under $8.0 billion was spent on federal employee wages and salaries, slightly less than 3 percent of the national total. This included $5.5 billion for civilian pay ($284 per capita, as shown in Figure 17) and $2.4 billion for military pay ($126 per capita). Overall, per capita expenditures in New York for wages and salaries, approximately $409, were 51 percent below the national level and ranked New York 42nd among all states.
FIGURE 17 - Per Capita Federal Wages and Salaries Spending, FFY 2019
The Federal Budget Deficit
The figures presented in this report are based on actual expenditures and revenues as reported by the federal government, with certain estimates and adjustments by the Office of the State Comptroller. Such figures reflect the budgetary imbalance associated with the federal budget deficit, which was $984 billion in FFY 2019. The federal deficit results from expenditures ($4.4 trillion in FFY 2019) exceeding revenues received the same year ($3.5 trillion), with the difference generally financed by borrowing that will be repaid in future years.
Federal budget deficits (or surpluses) shift over time depending on many factors, including changes in the economy and policy actions that affect levels of spending and revenues. The deficit for 2020 was $3.1 trillion, according to the federal Treasury Department. The Congressional Budget Office has forecast that the deficit will decrease in coming years but remain high by historical levels, estimating levels of $1.8 trillion in 2021 and averaging $1.2 trillion from 2022 through 2030. The record 2020 deficit is due primarily to the economic impact of the COVID-19 pandemic and enactment of large-scale federal relief and stimulus in response, along with continuing impacts from the Tax Cuts and Jobs Act and certain other spending changes. If Congress takes action in coming years to align federal revenues and spending, state-by-state impacts will depend in part on particular policy choices. For example, reductions in the defense budget would be expected to affect other states more than New York, while increases in federal income taxes, particularly for upper-income earners, could have a disproportionate impact on New York.
Assessing New York State’s Balance of Payments
Consideration of the balance of payments between New York (or any state) and the federal government often leads to questions regarding whether the State is receiving and paying its “fair share.” While the distribution of federal tax liability and spending is clearly unequal among the states, whether it is equitable is open to interpretation.
In 2019, New York was home to 5.9 percent of the U.S. population, and received 5.9 percent of the federal spending that was allocated among the states. As a result, its per capita share of federal spending was very close to the national average. As shown earlier in this report, in some categories such as Medicaid grants and funding for mass transit, New York received comparatively high levels of federal spending; in others, such as the military budget and highway aid, the State’s share was proportionally less than in most states. On the revenue side of the federal budget, tax receipts generated within New York were significantly higher than the national per capita average—largely because of individual income taxes, where New York’s per capita payment was higher than 47 other states. The bottom line: New York gives more than it gets.
While a state’s population obviously influences the level of its payments to and from Washington, a variety of economic, demographic and other factors also affect the levels of funding analyzed in this report. These include:
- Numbers of individuals in certain age groups, such as those eligible for Medicare because they are age 65 or older.
- Numbers of state residents living in poverty or within a certain multiple of the federal poverty level.
- Personal income levels, which affect the distribution of funding for a variety of programs.
- State policy choices. Numerous federal programs provide resources to support initiatives that are partly state-financed, so that state activities affect the flow of federal funds.
While New York’s per capita share of federal spending in FFY 2019 was close to the national average, its per capita contribution to federal revenues was among the highest in the nation. More than half of federal revenues came from the individual income tax, where New York’s share was 8.9 percent. The latter reflects the interplay of comparatively higher incomes in New York and a progressive federal income tax, with marginal rates in 2019 ranging from 10 percent up to 37 percent. New York’s comparatively high share of the nation’s high-income residents drives comparatively high levels of federal income tax payments from New York.
Overall, New York’s share of federal tax revenues, 8.1 percent, appears high if compared to the State’s 5.9 percent of the nation’s population. Total federal tax payments averaged $10,005 for every U.S. resident in FFY 2019, but were more than a third higher, at $13,626 per capita, in New York. Comparing tax revenues in the context of the states’ personal income levels offers a different perspective. New York generated 7.5 percent of U.S. personal income in 2019. That proportion was closer to New York’s share of federal tax revenues, although still lower.
Differences in the cost of living among states may affect the bottom-line impact of both federal expenditures and taxes. For example, individuals with income of $50,000 may pay a similar level of federal taxes regardless of where they live, but their purchasing power may vary widely depending on which region of the country or part of a state they have chosen to reside in.
The 2020 Census
As discussed earlier in this report, states’ population levels influence funding allocated through numerous federal aid programs. A complete, accurate count of New Yorkers in the 2020 Census is essential to ensure that the State receives its full allocation of resources through these programs, as well as its rightful share of representation in Congress.
While an accurate Census should be considered a matter of national interest, the challenges and barriers to achieving full participation differ among the states, particularly in the context of a global pandemic that has limited and shifted the U.S. Census Bureau’s previously planned approach to ensuring a complete count. Research by the Census Bureau has found that in the 2010 national census, certain groups had higher undercount rates than others. For example, according to the Census Bureau, African-American and Hispanic individuals were more likely to be undercounted than those who are white; and renters experienced a net undercount, while homeowners were slightly overcounted.11 New York State’s population includes higher proportions of these undercounted groups than the nation as a whole, according to Census figures.12
Foreign-born residents also make up a significantly higher proportion of New York residents—22.6 percent compared to 13.5 percent nationwide. Census Bureau researchers and some other analysts have warned that many immigrants may be reluctant to respond to the 2020 Census because of fears related to confidentiality and potential data-sharing with other federal agencies.13 The end to Census field data collection activities as of October 15 may leave significant numbers of individuals in such hard-to-count communities excluded from the 2020 tally.
Aside from harmful impacts on federal aid programs, an undercount of New York State’s population could further diminish its representation in the U.S. House of Representatives. Currently, based on the 2010 Census, New York holds 27 seats in the House. Based on recent Census Bureau population estimates, the State is likely to lose at least one House seat after the 2020 Census, continuing a long-term trend since apportionment based on the 1950 Census reduced New York’s representation from 45 to 43 seats. Depending on national population trends, an undercount in New York could make the difference between one and two lost Congressional seats after the 2020 Census. Such an outcome could have harmful implications for the State’s interests in federal funding and policy decisions for years to come.
Conclusion
In the spirit of the reports on “The Federal Budget and the States” published over many years by the late Senator Daniel Patrick Moynihan, this report seeks to inform debate over the federal government’s relationship with New York, and with the states in general, by comparing federal spending, federal taxes paid, and the resulting balance of payments in New York and the other states. The imbalance between taxes paid by New Yorkers to the federal government and moneys received in return through federal spending may raise questions about fiscal equity. Certainly, the impacts of the COVID-19 pandemic on states’ economies and budgets have highlighted the important role the federal budget plays in the fiscal condition of New York and all the states.
In the New York State Budget, federal receipts represent approximately one-third of all revenue received by the State. Millions of New Yorkers rely on Social Security as a staple of household income, on Medicare and/or Medicaid for essential health care, and on the Supplemental Nutrition Assistance Program for basic food needs. In education alone, federal grants provide important support for services to children with disabilities or limited English proficiency, breakfast and lunch programs, and college loans, as well as other programs. Other federal funds pay for essential capital projects and services (such as highway and mass transit construction and maintenance), housing, job training, environmental protection, public safety initiatives and far more. This is apart from the support provided to date to states and localities in FFY 2020 through federal assistance that does not come close to fully addressing New York’s drastically reduced tax revenues and need to provide services in response to the COVID-19 pandemic.
As this report has shown, New Yorkers are directly and sometimes profoundly affected by many aspects of the federal budget. The debate in Washington must be informed by a careful consideration of the fiscal and human impacts of current federal policies, as well as any changes to be made going forward.
Footnotes
1 For data consistency, national totals and averages in this report include expenditures in and revenues from the District of Columbia in addition to the states. However, because it is an outlier in many categories, the District of Columbia is not included in the rankings of the states. References to the states as a group in this report include the District of Columbia, unless otherwise noted. Rankings in this report and related materials are based on unrounded amounts.
2 Customs duties and fees (including tariffs) and miscellaneous receipts, such as deposits of earnings by the Federal Reserve, are excluded from revenues. Undistributed offsetting receipts, net interest on the federal government debt and spending for international affairs and overseas procurement (military- and non-military-related) represent most of the outlays excluded from this analysis. Receipts from and outlays to Puerto Rico and other outlying areas are also excluded. See Appendix B: Methodology.
3 Excel files providing detailed figures beyond those in this report can be accessed at https://www.osc.state.ny.us/files/reports/budget/2020/excel/federal-budget-fiscal-year-2019.xlsx.
4 Federal tax changes enacted at the end of 2017 reduced individual income tax payments both nationally and in New York State during federal tax year 2018. The contrast between declines in such payments during the tax year and increases during the fiscal year reflects timing differences as well as economic factors. For purposes of this report, allocations of individual taxes are based on liability reported on 2018 federal income tax returns (federal tax years are calendar years; for example, tax year 2018 was January 1 through December 31, 2018). Individual income tax collections during the fiscal year (the 2019 federal fiscal year was October 1, 2018 through September 30, 2019) include withholding and estimated tax payments on income partially incurred in calendar year 2019, reflecting economic changes such as those in wages, other non-wage income and employment.
5 Social insurance taxes and contributions include: (1) FICA (the Federal Insurance Contributions Act tax), withheld for Social Security and Medicare; (2) SECA (the Self-Employment Contributions Act tax), paid by self-employed small business owners on their net earnings to cover their Social Security, Medicare, and Old Age Survivors and Disability Insurance (OASDI) costs; (3) FUTA (the Federal Unemployment Tax Act tax), withheld for unemployment compensation; (4) RRA and the RUIA (the Railroad Retirement Act and the Railroad Unemployment Insurance Act taxes), used in place of FICA, SECA and FUTA for railroad employees; and (5) other receipts, primarily pension contributions from federal employees.
6 See footnote 2 and Appendix B for a description of outlays which are excluded from this analysis.
7 Veterans benefits include: (1) payments for service-connected disability; (2) payments for non-service-connected disability; (3) educational and training services; and (4) hospital and medical care.
8 Programs included in the categories represented in Figure 15 are: Housing: Section 8 Rental Assistance, Public Housing Capital and Operating Funds; Child Nutrition: School Lunch, School Breakfast, Summer Food and other programs; Child and Family Services: Head Start, Community Services Block Grant and other programs; All Other: Adoption and Foster Care Payments, Special Supplemental Nutrition Program for Women, Infants and Children, Low-Income Home Energy Assistance, Child Care and Development Block Grant and other programs.
9 This amount does not include $33.5 billion in such spending in other countries. (As elsewhere in this analysis, it also does not include $2.7 billion in expenditures in Puerto Rico and other outlying areas.)
10 This figure represents direct obligations for wages and salaries. While such payments may also be made through reimbursable obligations, this analysis does not include those amounts in its figures for wages and salaries, since reimbursable obligations represent spending accounted for elsewhere in the federal budget.
11 U.S. Census Bureau, DSSD (Decennial Statistical Studies Division) 2010 Census Coverage Measurement Memorandum Series #2010-G-01, May 2012, available at https://www2.census.gov/programs-surveys/decennial/2010/technical-documentation/methodology/g-series/g01.pdf.
12 U.S. Census Bureau, QuickFacts: New York; United States, available at https://www.census.gov/quickfacts/fact/table/NY,US/PST045219.
13 U.S. Census Bureau Center for Survey Measurement, “Respondent Confidentiality Concerns,” memorandum for the associate directorate for research and methodology, September 20, 2017, available at https://www2.census.gov/cac/nac/meetings/2017-11/ Memo-Regarding-Respondent-Confidentiality-Concerns.pdf.
Appendix A: Federal Revenues and Expenditures by State
Balance of Payments (Expenditures Minus Revenues), FFY 2019
| Total (millions) | Per Capita | Variation from National Per Capita |
Percentage Variation from National Per Capita |
Rank (per capita) | |
|---|---|---|---|---|---|
| National: 50 States & D.C. | $796,402 | $2,426 | |||
| Alabama | $40,090 | $8,176 | $5,750 | 237.0% | 6 |
| Alaska | $6,314 | $8,631 | $6,205 | 255.7% | 5 |
| Arizona | $36,033 | $4,950 | $2,524 | 104.0% | 16 |
| Arkansas | $15,420 | $5,110 | $2,684 | 110.6% | 12 |
| California | ($14,489) | ($367) | ($2,793) | (115.1%) | 45 |
| Colorado | $3,424 | $595 | ($1,832) | (75.5%) | 41 |
| Connecticut | $4,506 | $1,264 | ($1,162) | (47.9%) | 37 |
| Delaware | $912 | $937 | ($1,489) | (61.4%) | 39 |
| Florida | $69,756 | $3,248 | $822 | 33.9% | 22 |
| Georgia | $25,959 | $2,445 | $19 | .8% | 28 |
| Hawaii | $10,164 | $7,179 | $4,752 | 195.9% | 10 |
| Idaho | $7,120 | $3,984 | $1,558 | 64.2% | 19 |
| Illinois | ($11,192) | ($883) | ($3,310) | (136.4%) | 46 |
| Indiana | $17,391 | $2,583 | $157 | 6.5% | 27 |
| Iowa | $6,212 | $1,969 | ($457) | (18.9%) | 32 |
| Kansas | $5,901 | $2,026 | ($401) | (16.5%) | 31 |
| Kentucky | $32,958 | $7,377 | $4,951 | 204.0% | 9 |
| Louisiana | $23,387 | $5,031 | $2,605 | 107.3% | 15 |
| Maine | $10,132 | $7,537 | $5,111 | 210.6% | 8 |
| Maryland | $47,041 | $7,781 | $5,355 | 220.7% | 7 |
| Massachusetts | ($7,951) | ($1,154) | ($3,580) | (147.5%) | 48 |
| Michigan | $28,171 | $2,821 | $395 | 16.3% | 26 |
| Minnesota | ($5,303) | ($940) | ($3,367) | (138.8%) | 47 |
| Mississippi | $26,152 | $8,787 | $6,361 | 262.2% | 3 |
| Missouri | $30,981 | $5,048 | $2,622 | 108.1% | 14 |
| Montana | $5,173 | $4,840 | $2,414 | 99.5% | 17 |
| Nebraska | $1,477 | $764 | ($1,663) | (68.5%) | 40 |
| Nevada | $3,572 | $1,160 | ($1,267) | (52.2%) | 38 |
| New Hampshire | $616 | $453 | ($1,973) | (81.3%) | 43 |
| New Jersey | ($21,764) | ($2,450) | ($4,877) | (201.0%) | 50 |
| New Mexico | $24,523 | $11,695 | $9,269 | 382.0% | 1 |
| NEW YORK | ($23,707) | ($1,219) | ($3,645) | (150.2%) | 49 |
| North Carolina | $37,872 | $3,611 | $1,185 | 48.8% | 21 |
| North Dakota | $1,006 | $1,320 | ($1,107) | (45.6%) | 36 |
| Ohio | $34,058 | $2,914 | $487 | 20.1% | 25 |
| Oklahoma | $19,976 | $5,048 | $2,622 | 108.1% | 13 |
| Oregon | $10,212 | $2,421 | ($5) | (.2%) | 29 |
| Pennsylvania | $40,162 | $3,137 | $711 | 29.3% | 23 |
| Rhode Island | $3,306 | $3,121 | $695 | 28.6% | 24 |
| South Carolina | $28,285 | $5,494 | $3,067 | 126.4% | 11 |
| South Dakota | $1,234 | $1,395 | ($1,031) | (42.5%) | 34 |
| Tennessee | $25,433 | $3,724 | $1,298 | 53.5% | 20 |
| Texas | $42,785 | $1,476 | ($951) | (39.2%) | 33 |
| Utah | $619 | $193 | ($2,233) | (92.0%) | 44 |
| Vermont | $2,666 | $4,272 | $1,846 | 76.1% | 18 |
| Virginia | $79,609 | $9,327 | $6,901 | 284.4% | 2 |
| Washington | $4,072 | $535 | ($1,892) | (78.0%) | 42 |
| West Virginia | $15,742 | $8,784 | $6,357 | 262.0% | 4 |
| Wisconsin | $7,760 | $1,333 | ($1,093) | (45.1%) | 35 |
| Wyoming | $1,241 | $2,144 | ($282) | (11.6%) | 30 |
| District of Columbia | $41,385 | $58,640 | $56,213 | 2,316.9% |
Note: Does not include spending in or taxes from Puerto Rico and other outlying areas.
Taxes Paid to the Federal Government, FFY 2019
| Total (millions) | Per Capita | Variation from National Per Capita |
Percentage Variation from National Per Capita |
Rank (per capita) | |
|---|---|---|---|---|---|
| National: 50 States & D.C. | $3,284,050 | $10,005 | |||
| Alabama | $34,198 | $6,975 | ($3,030) | (30.3%) | 46 |
| Alaska | $6,878 | $9,402 | ($604) | (6.0%) | 23 |
| Arizona | $56,724 | $7,793 | ($2,212) | (22.1%) | 38 |
| Arkansas | $20,980 | $6,952 | ($3,053) | (30.5%) | 47 |
| California | $464,593 | $11,758 | $1,753 | 17.5% | 8 |
| Colorado | $61,547 | $10,688 | $682 | 6.8% | 14 |
| Connecticut | $53,148 | $14,907 | $4,902 | 49.0% | 1 |
| Delaware | $11,669 | $11,983 | $1,978 | 19.8% | 6 |
| Florida | $203,617 | $9,480 | ($525) | (5.2%) | 21 |
| Georgia | $89,200 | $8,401 | ($1,604) | (16.0%) | 32 |
| Hawaii | $12,743 | $9,000 | ($1,005) | (10.0%) | 25 |
| Idaho | $12,960 | $7,252 | ($2,753) | (27.5%) | 43 |
| Illinois | $141,896 | $11,198 | $1,193 | 11.9% | 10 |
| Indiana | $55,018 | $8,172 | ($1,833) | (18.3%) | 37 |
| Iowa | $27,022 | $8,565 | ($1,441) | (14.4%) | 30 |
| Kansas | $25,934 | $8,902 | ($1,103) | (11.0%) | 28 |
| Kentucky | $31,372 | $7,022 | ($2,983) | (29.8%) | 45 |
| Louisiana | $34,132 | $7,342 | ($2,663) | (26.6%) | 42 |
| Maine | $10,418 | $7,750 | ($2,255) | (22.5%) | 40 |
| Maryland | $70,992 | $11,743 | $1,738 | 17.4% | 9 |
| Massachusetts | $98,870 | $14,345 | $4,340 | 43.4% | 2 |
| Michigan | $88,271 | $8,839 | ($1,166) | (11.7%) | 29 |
| Minnesota | $62,267 | $11,041 | $1,036 | 10.4% | 11 |
| Mississippi | $17,403 | $5,848 | ($4,158) | (41.6%) | 50 |
| Missouri | $51,078 | $8,322 | ($1,683) | (16.8%) | 33 |
| Montana | $8,325 | $7,789 | ($2,216) | (22.2%) | 39 |
| Nebraska | $18,495 | $9,561 | ($444) | (4.4%) | 20 |
| Nevada | $29,933 | $9,718 | ($287) | (2.9%) | 19 |
| New Hampshire | $16,184 | $11,903 | $1,898 | 19.0% | 7 |
| New Jersey | $119,949 | $13,504 | $3,499 | 35.0% | 4 |
| New Mexico | $13,391 | $6,387 | ($3,619) | (36.2%) | 48 |
| NEW YORK | $265,075 | $13,626 | $3,621 | 36.2% | 3 |
| North Carolina | $85,783 | $8,179 | ($1,826) | (18.3%) | 36 |
| North Dakota | $7,553 | $9,911 | ($94) | (.9%) | 18 |
| Ohio | $98,263 | $8,406 | ($1,599) | (16.0%) | 31 |
| Oklahoma | $28,492 | $7,201 | ($2,805) | (28.0%) | 44 |
| Oregon | $37,911 | $8,988 | ($1,017) | (10.2%) | 26 |
| Pennsylvania | $127,369 | $9,949 | ($56) | (.6%) | 16 |
| Rhode Island | $10,536 | $9,946 | ($59) | (.6%) | 17 |
| South Carolina | $37,959 | $7,373 | ($2,633) | (26.3%) | 41 |
| South Dakota | $9,188 | $10,386 | $381 | 3.8% | 15 |
| Tennessee | $56,116 | $8,217 | ($1,788) | (17.9%) | 35 |
| Texas | $269,606 | $9,298 | ($707) | (7.1%) | 24 |
| Utah | $26,508 | $8,268 | ($1,737) | (17.4%) | 34 |
| Vermont | $5,597 | $8,969 | ($1,036) | (10.4%) | 27 |
| Virginia | $92,649 | $10,855 | $850 | 8.5% | 13 |
| Washington | $91,528 | $12,020 | $2,015 | 20.1% | 5 |
| West Virginia | $11,030 | $6,154 | ($3,851) | (38.5%) | 49 |
| Wisconsin | $54,889 | $9,427 | ($578) | (5.8%) | 22 |
| Wyoming | $6,282 | $10,855 | $850 | 8.5% | 12 |
| District of Columbia | $12,507 | $17,722 | $7,717 | 77.1% |
Note: Does not include taxes paid from Puerto Rico and other outlying areas.
Federal Taxes by Category, FFY 2019 (millions)
| Income Tax Less Refunds | Social Insurance | Corporate | Excise | Estate and Gift | |
|---|---|---|---|---|---|
| National: 50 States & D.C. | $1,702,722 | $1,235,690 | $230,245 | $99,321 | $16,072 |
| Alabama | $15,039 | $15,028 | $2,458 | $1,589 | $83 |
| Alaska | $3,393 | $2,808 | $348 | $278 | $50 |
| Arizona | $27,903 | $23,028 | $3,513 | $2,097 | $183 |
| Arkansas | $9,134 | $9,189 | $1,649 | $974 | $33 |
| California | $261,697 | $157,319 | $32,432 | $10,259 | $2,884 |
| Colorado | $32,850 | $22,604 | $3,706 | $2,004 | $383 |
| Connecticut | $31,137 | $17,398 | $3,538 | $825 | $250 |
| Delaware | $6,408 | $3,953 | $1,014 | $277 | $17 |
| Florida | $116,153 | $68,855 | $10,237 | $6,671 | $1,701 |
| Georgia | $41,780 | $36,232 | $7,058 | $3,863 | $267 |
| Hawaii | $5,877 | $5,595 | $640 | $580 | $50 |
| Idaho | $6,156 | $5,477 | $763 | $531 | $33 |
| Illinois | $76,158 | $50,685 | $10,539 | $3,896 | $617 |
| Indiana | $23,997 | $23,681 | $4,951 | $2,156 | $233 |
| Iowa | $11,776 | $11,615 | $2,551 | $1,030 | $50 |
| Kansas | $12,183 | $10,807 | $2,031 | $763 | $150 |
| Kentucky | $13,663 | $13,514 | $2,458 | $1,604 | $133 |
| Louisiana | $15,504 | $13,935 | $3,056 | $1,487 | $150 |
| Maine | $4,847 | $4,447 | $665 | $427 | $33 |
| Maryland | $36,751 | $28,998 | $3,364 | $1,596 | $283 |
| Massachusetts | $57,756 | $32,548 | $6,233 | $1,800 | $534 |
| Michigan | $42,428 | $36,189 | $6,327 | $2,878 | $450 |
| Minnesota | $30,161 | $25,299 | $4,872 | $1,785 | $150 |
| Mississippi | $6,976 | $8,122 | $1,243 | $1,046 | $17 |
| Missouri | $24,126 | $20,593 | $3,900 | $2,275 | $183 |
| Montana | $3,879 | $3,616 | $420 | $392 | $17 |
| Nebraska | $7,628 | $8,475 | $1,473 | $653 | $267 |
| Nevada | $17,606 | $9,223 | $1,647 | $1,225 | $233 |
| New Hampshire | $8,320 | $6,395 | $979 | $457 | $33 |
| New Jersey | $65,922 | $44,087 | $7,026 | $2,446 | $467 |
| New Mexico | $6,149 | $5,876 | $656 | $694 | $17 |
| NEW YORK | $151,870 | $87,667 | $19,407 | $4,448 | $1,684 |
| North Carolina | $40,130 | $34,948 | $7,067 | $3,388 | $250 |
| North Dakota | $3,499 | $3,198 | $493 | $346 | $17 |
| Ohio | $46,266 | $39,509 | $8,896 | $3,359 | $233 |
| Oklahoma | $13,010 | $12,232 | $1,791 | $1,360 | $100 |
| Oregon | $18,353 | $15,356 | $2,817 | $1,269 | $117 |
| Pennsylvania | $63,144 | $50,781 | $9,375 | $3,585 | $483 |
| Rhode Island | $5,161 | $4,383 | $690 | $252 | $50 |
| South Carolina | $17,483 | $16,075 | $2,596 | $1,689 | $117 |
| South Dakota | $4,897 | $3,339 | $620 | $316 | $17 |
| Tennessee | $26,290 | $23,253 | $4,279 | $2,227 | $67 |
| Texas | $137,664 | $99,804 | $20,587 | $9,867 | $1,684 |
| Utah | $12,752 | $10,802 | $1,994 | $926 | $33 |
| Vermont | $2,614 | $2,471 | $313 | $182 | $17 |
| Virginia | $46,807 | $37,736 | $4,960 | $2,881 | $267 |
| Washington | $48,766 | $33,580 | $6,562 | $2,037 | $584 |
| West Virginia | $4,647 | $5,074 | $650 | $609 | $50 |
| Wisconsin | $25,896 | $22,760 | $4,460 | $1,640 | $133 |
| Wyoming | $3,421 | $2,116 | $277 | $285 | $183 |
| District of Columbia | $6,696 | $5,013 | $668 | $97 | $33 |
Note: Does not include taxes paid from Puerto Rico and other outlying areas.
Expenditures by the Federal Government, FFY 2019
| Total (millions) | Per Capita | Variation from National Per Capita |
Percentage Variation from National Per Capita |
Rank (per capita) | |
|---|---|---|---|---|---|
| National: 50 States & D.C. | $4,080,452 | $12,431 | |||
| Alabama | $74,288 | $15,151 | $2,720 | 21.9% | 8 |
| Alaska | $13,192 | $18,033 | $5,601 | 45.1% | 4 |
| Arizona | $92,757 | $12,744 | $312 | 2.5% | 20 |
| Arkansas | $36,401 | $12,062 | ($369) | (3.0%) | 28 |
| California | $450,103 | $11,391 | ($1,040) | (8.4%) | 34 |
| Colorado | $64,970 | $11,282 | ($1,149) | (9.2%) | 36 |
| Connecticut | $57,655 | $16,171 | $3,740 | 30.1% | 6 |
| Delaware | $12,581 | $12,920 | $489 | 3.9% | 18 |
| Florida | $273,373 | $12,728 | $297 | 2.4% | 21 |
| Georgia | $115,158 | $10,846 | ($1,585) | (12.8%) | 42 |
| Hawaii | $22,907 | $16,178 | $3,747 | 30.1% | 5 |
| Idaho | $20,081 | $11,237 | ($1,195) | (9.6%) | 37 |
| Illinois | $130,703 | $10,314 | ($2,117) | (17.0%) | 48 |
| Indiana | $72,409 | $10,756 | ($1,676) | (13.5%) | 45 |
| Iowa | $33,234 | $10,533 | ($1,898) | (15.3%) | 46 |
| Kansas | $31,835 | $10,928 | ($1,504) | (12.1%) | 40 |
| Kentucky | $64,330 | $14,399 | $1,968 | 15.8% | 11 |
| Louisiana | $57,519 | $12,373 | ($58) | (.5%) | 25 |
| Maine | $20,550 | $15,288 | $2,856 | 23.0% | 7 |
| Maryland | $118,033 | $19,524 | $7,092 | 57.1% | 2 |
| Massachusetts | $90,920 | $13,191 | $760 | 6.1% | 14 |
| Michigan | $116,443 | $11,660 | ($772) | (6.2%) | 32 |
| Minnesota | $56,964 | $10,101 | ($2,331) | (18.7%) | 49 |
| Mississippi | $43,556 | $14,635 | $2,204 | 17.7% | 10 |
| Missouri | $82,059 | $13,370 | $939 | 7.6% | 12 |
| Montana | $13,498 | $12,629 | $198 | 1.6% | 22 |
| Nebraska | $19,973 | $10,325 | ($2,106) | (16.9%) | 47 |
| Nevada | $33,505 | $10,878 | ($1,554) | (12.5%) | 41 |
| New Hampshire | $16,800 | $12,356 | ($76) | (.6%) | 26 |
| New Jersey | $98,185 | $11,054 | ($1,377) | (11.1%) | 39 |
| New Mexico | $37,915 | $18,082 | $5,651 | 45.5% | 3 |
| NEW YORK | $241,369 | $12,407 | ($24) | (.2%) | 24 |
| North Carolina | $123,655 | $11,790 | ($641) | (5.2%) | 30 |
| North Dakota | $8,559 | $11,231 | ($1,201) | (9.7%) | 38 |
| Ohio | $132,321 | $11,320 | ($1,111) | (8.9%) | 35 |
| Oklahoma | $48,468 | $12,249 | ($183) | (1.5%) | 27 |
| Oregon | $48,122 | $11,410 | ($1,022) | (8.2%) | 33 |
| Pennsylvania | $167,531 | $13,086 | $655 | 5.3% | 15 |
| Rhode Island | $13,843 | $13,067 | $636 | 5.1% | 16 |
| South Carolina | $66,244 | $12,866 | $435 | 3.5% | 19 |
| South Dakota | $10,422 | $11,781 | ($650) | (5.2%) | 31 |
| Tennessee | $81,549 | $11,941 | ($490) | (3.9%) | 29 |
| Texas | $312,391 | $10,774 | ($1,658) | (13.3%) | 43 |
| Utah | $27,127 | $8,462 | ($3,970) | (31.9%) | 50 |
| Vermont | $8,262 | $13,241 | $810 | 6.5% | 13 |
| Virginia | $172,258 | $20,181 | $7,750 | 62.3% | 1 |
| Washington | $95,600 | $12,554 | $123 | 1.0% | 23 |
| West Virginia | $26,771 | $14,938 | $2,507 | 20.2% | 9 |
| Wisconsin | $62,649 | $10,760 | ($1,671) | (13.4%) | 44 |
| Wyoming | $7,523 | $12,999 | $568 | 4.6% | 17 |
| District of Columbia | $53,892 | $76,361 | $63,930 | 514.3% |
Note: Does not include spending in Puerto Rico and other outlying areas.
Federal Expenditures: Direct Payments, FFY 2019
| Total (millions) | Per Capita | Variation from National Per Capita |
Percentage Variation from National Per Capita |
Rank (per capita) | |
|---|---|---|---|---|---|
| National: 50 States & D.C. | $2,545,562 | $7,755 | |||
| Alabama | $45,906 | $9,362 | $1,607 | 20.7% | 4 |
| Alaska | $4,892 | $6,688 | ($1,067) | (13.8%) | 46 |
| Arizona | $55,518 | $7,628 | ($128) | (1.6%) | 33 |
| Arkansas | $25,620 | $8,490 | $735 | 9.5% | 12 |
| California | $263,262 | $6,663 | ($1,092) | (14.1%) | 47 |
| Colorado | $37,930 | $6,587 | ($1,169) | (15.1%) | 48 |
| Connecticut | $28,422 | $7,972 | $217 | 2.8% | 26 |
| Delaware | $9,101 | $9,346 | $1,591 | 20.5% | 5 |
| Florida | $202,230 | $9,416 | $1,661 | 21.4% | 3 |
| Georgia | $78,719 | $7,414 | ($341) | (4.4%) | 41 |
| Hawaii | $11,687 | $8,254 | $499 | 6.4% | 22 |
| Idaho | $13,342 | $7,466 | ($290) | (3.7%) | 40 |
| Illinois | $91,232 | $7,200 | ($556) | (7.2%) | 43 |
| Indiana | $50,811 | $7,547 | ($208) | (2.7%) | 37 |
| Iowa | $23,813 | $7,547 | ($208) | (2.7%) | 38 |
| Kansas | $22,054 | $7,570 | ($185) | (2.4%) | 36 |
| Kentucky | $37,045 | $8,292 | $536 | 6.9% | 21 |
| Louisiana | $36,968 | $7,952 | $197 | 2.5% | 27 |
| Maine | $12,765 | $9,496 | $1,741 | 22.5% | 2 |
| Maryland | $51,497 | $8,518 | $763 | 9.8% | 11 |
| Massachusetts | $53,753 | $7,799 | $44 | .6% | 30 |
| Michigan | $84,095 | $8,421 | $665 | 8.6% | 15 |
| Minnesota | $39,699 | $7,039 | ($716) | (9.2%) | 44 |
| Mississippi | $26,152 | $8,787 | $1,032 | 13.3% | 7 |
| Missouri | $50,113 | $8,165 | $410 | 5.3% | 23 |
| Montana | $8,869 | $8,298 | $543 | 7.0% | 18 |
| Nebraska | $14,498 | $7,495 | ($260) | (3.4%) | 39 |
| Nevada | $23,323 | $7,572 | ($183) | (2.4%) | 35 |
| New Hampshire | $11,540 | $8,487 | $732 | 9.4% | 13 |
| New Jersey | $67,981 | $7,654 | ($102) | (1.3%) | 32 |
| New Mexico | $17,387 | $8,292 | $537 | 6.9% | 20 |
| NEW YORK | $148,062 | $7,611 | ($144) | (1.9%) | 34 |
| North Carolina | $86,968 | $8,292 | $537 | 6.9% | 19 |
| North Dakota | $5,148 | $6,756 | ($999) | (12.9%) | 45 |
| Ohio | $91,886 | $7,861 | $106 | 1.4% | 29 |
| Oklahoma | $32,859 | $8,304 | $549 | 7.1% | 17 |
| Oregon | $33,747 | $8,001 | $246 | 3.2% | 25 |
| Pennsylvania | $111,239 | $8,689 | $934 | 12.0% | 9 |
| Rhode Island | $9,145 | $8,633 | $877 | 11.3% | 10 |
| South Carolina | $46,628 | $9,056 | $1,301 | 16.8% | 6 |
| South Dakota | $7,000 | $7,912 | $157 | 2.0% | 28 |
| Tennessee | $57,090 | $8,360 | $604 | 7.8% | 16 |
| Texas | $190,731 | $6,578 | ($1,177) | (15.2%) | 49 |
| Utah | $17,638 | $5,502 | ($2,254) | (29.1%) | 50 |
| Vermont | $5,442 | $8,721 | $966 | 12.5% | 8 |
| Virginia | $72,303 | $8,471 | $716 | 9.2% | 14 |
| Washington | $55,328 | $7,266 | ($489) | (6.3%) | 42 |
| West Virginia | $18,017 | $10,053 | $2,298 | 29.6% | 1 |
| Wisconsin | $45,296 | $7,779 | $24 | .3% | 31 |
| Wyoming | $4,642 | $8,021 | $266 | 3.4% | 24 |
| District of Columbia | $6,169 | $8,741 | $986 | 12.7% |
Note: Does not include spending for direct payments in Puerto Rico and other outlying areas
Federal Expenditures: Grants, FFY 2019
| Total (millions) | Per Capita | Variation from National Per Capita |
Percentage Variation from National Per Capita |
Rank (per capita) | |
|---|---|---|---|---|---|
| National: 50 States & D.C. | $711,299 | $2,167 | |||
| Alabama | $8,983 | $1,832 | ($335) | (15.5%) | 33 |
| Alaska | $3,475 | $4,750 | $2,583 | 119.2% | 1 |
| Arizona | $15,720 | $2,160 | ($7) | (.3%) | 25 |
| Arkansas | $8,322 | $2,758 | $591 | 27.3% | 10 |
| California | $98,288 | $2,488 | $321 | 14.8% | 16 |
| Colorado | $9,579 | $1,663 | ($504) | (23.2%) | 43 |
| Connecticut | $8,776 | $2,461 | $294 | 13.6% | 17 |
| Delaware | $2,471 | $2,538 | $371 | 17.1% | 15 |
| Florida | $31,535 | $1,468 | ($699) | (32.2%) | 49 |
| Georgia | $16,206 | $1,526 | ($641) | (29.6%) | 45 |
| Hawaii | $2,841 | $2,007 | ($160) | (7.4%) | 29 |
| Idaho | $3,073 | $1,720 | ($447) | (20.6%) | 39 |
| Illinois | $23,045 | $1,819 | ($348) | (16.1%) | 34 |
| Indiana | $14,551 | $2,161 | ($6) | (.3%) | 24 |
| Iowa | $6,083 | $1,928 | ($239) | (11.0%) | 31 |
| Kansas | $4,422 | $1,518 | ($649) | (30.0%) | 46 |
| Kentucky | $12,730 | $2,849 | $682 | 31.5% | 8 |
| Louisiana | $13,921 | $2,995 | $828 | 38.2% | 6 |
| Maine | $3,273 | $2,435 | $268 | 12.4% | 18 |
| Maryland | $12,696 | $2,100 | ($67) | (3.1%) | 26 |
| Massachusetts | $17,896 | $2,596 | $429 | 19.8% | 13 |
| Michigan | $22,061 | $2,209 | $42 | 1.9% | 23 |
| Minnesota | $12,618 | $2,237 | $70 | 3.2% | 22 |
| Mississippi | $7,588 | $2,549 | $382 | 17.6% | 14 |
| Missouri | $12,335 | $2,010 | ($157) | (7.3%) | 28 |
| Montana | $2,936 | $2,747 | $580 | 26.8% | 11 |
| Nebraska | $2,880 | $1,489 | ($678) | (31.3%) | 48 |
| Nevada | $5,244 | $1,702 | ($465) | (21.4%) | 40 |
| New Hampshire | $2,207 | $1,623 | ($544) | (25.1%) | 44 |
| New Jersey | $18,489 | $2,082 | ($85) | (3.9%) | 27 |
| New Mexico | $7,582 | $3,616 | $1,449 | 66.9% | 3 |
| NEW YORK | $73,449 | $3,776 | $1,609 | 74.2% | 2 |
| North Carolina | $18,116 | $1,727 | ($440) | (20.3%) | 38 |
| North Dakota | $1,816 | $2,383 | $216 | 10.0% | 20 |
| Ohio | $27,133 | $2,321 | $154 | 7.1% | 21 |
| Oklahoma | $6,987 | $1,766 | ($401) | (18.5%) | 37 |
| Oregon | $11,068 | $2,624 | $457 | 21.1% | 12 |
| Pennsylvania | $31,168 | $2,435 | $268 | 12.3% | 19 |
| Rhode Island | $2,949 | $2,784 | $617 | 28.5% | 9 |
| South Carolina | $8,703 | $1,690 | ($477) | (22.0%) | 41 |
| South Dakota | $1,585 | $1,791 | ($376) | (17.3%) | 36 |
| Tennessee | $12,526 | $1,834 | ($333) | (15.4%) | 32 |
| Texas | $48,527 | $1,674 | ($493) | (22.8%) | 42 |
| Utah | $4,212 | $1,314 | ($853) | (39.4%) | 50 |
| Vermont | $1,961 | $3,142 | $975 | 45.0% | 4 |
| Virginia | $12,734 | $1,492 | ($675) | (31.2%) | 47 |
| Washington | $15,044 | $1,976 | ($191) | (8.8%) | 30 |
| West Virginia | $5,374 | $2,998 | $831 | 38.4% | 5 |
| Wisconsin | $10,462 | $1,797 | ($370) | (17.1%) | 35 |
| Wyoming | $1,730 | $2,989 | $822 | 37.9% | 7 |
| District of Columbia | $3,929 | $5,567 | $3,400 | 156.9% |
Note: Does not include spending for grants in Puerto Rico and other outlying areas.
Federal Expenditures: Procurement, FFY 2019
| Total (millions) | Per Capita | Variation from National Per Capita |
Percentage Variation from National Per Capita |
Rank (per capita) | |
|---|---|---|---|---|---|
| National: 50 States & D.C. | $550,129 | $1,676 | |||
| Alabama | $14,713 | $3,001 | $1,325 | 79.0% | 6 |
| Alaska | $2,315 | $3,165 | $1,489 | 88.8% | 5 |
| Arizona | $16,617 | $2,283 | $607 | 36.2% | 12 |
| Arkansas | $965 | $320 | ($1,356) | (80.9%) | 50 |
| California | $62,407 | $1,579 | ($97) | (5.8%) | 18 |
| Colorado | $11,178 | $1,941 | $265 | 15.8% | 14 |
| Connecticut | $19,098 | $5,357 | $3,681 | 219.6% | 3 |
| Delaware | $395 | $406 | ($1,270) | (75.8%) | 48 |
| Florida | $26,783 | $1,247 | ($429) | (25.6%) | 23 |
| Georgia | $9,129 | $860 | ($816) | (48.7%) | 30 |
| Hawaii | $2,567 | $1,813 | $137 | 8.2% | 16 |
| Idaho | $2,639 | $1,477 | ($199) | (11.9%) | 20 |
| Illinois | $10,527 | $831 | ($845) | (50.4%) | 33 |
| Indiana | $4,707 | $699 | ($977) | (58.3%) | 40 |
| Iowa | $2,408 | $763 | ($913) | (54.5%) | 35 |
| Kansas | $2,276 | $781 | ($895) | (53.4%) | 34 |
| Kentucky | $10,221 | $2,288 | $612 | 36.5% | 11 |
| Louisiana | $3,430 | $738 | ($938) | (56.0%) | 37 |
| Maine | $3,344 | $2,488 | $812 | 48.4% | 8 |
| Maryland | $35,956 | $5,947 | $4,271 | 254.9% | 2 |
| Massachusetts | $16,194 | $2,350 | $674 | 40.2% | 10 |
| Michigan | $7,357 | $737 | ($939) | (56.0%) | 38 |
| Minnesota | $2,717 | $482 | ($1,194) | (71.3%) | 47 |
| Mississippi | $7,348 | $2,469 | $793 | 47.3% | 9 |
| Missouri | $15,296 | $2,492 | $816 | 48.7% | 7 |
| Montana | $667 | $624 | ($1,052) | (62.8%) | 43 |
| Nebraska | $1,144 | $591 | ($1,085) | (64.7%) | 45 |
| Nevada | $2,939 | $954 | ($722) | (43.1%) | 27 |
| New Hampshire | $2,552 | $1,877 | $201 | 12.0% | 15 |
| New Jersey | $8,454 | $952 | ($724) | (43.2%) | 28 |
| New Mexico | $10,180 | $4,855 | $3,179 | 189.7% | 4 |
| NEW YORK | $11,900 | $612 | ($1,064) | (63.5%) | 44 |
| North Carolina | $7,114 | $678 | ($998) | (59.5%) | 41 |
| North Dakota | $567 | $744 | ($932) | (55.6%) | 36 |
| Ohio | $7,893 | $675 | ($1,001) | (59.7%) | 42 |
| Oklahoma | $4,232 | $1,070 | ($606) | (36.2%) | 25 |
| Oregon | $1,441 | $342 | ($1,334) | (79.6%) | 49 |
| Pennsylvania | $19,150 | $1,496 | ($180) | (10.7%) | 19 |
| Rhode Island | $762 | $719 | ($957) | (57.1%) | 39 |
| South Carolina | $6,434 | $1,250 | ($426) | (25.4%) | 22 |
| South Dakota | $953 | $1,077 | ($599) | (35.7%) | 24 |
| Tennessee | $8,539 | $1,250 | ($426) | (25.4%) | 21 |
| Texas | $51,674 | $1,782 | $106 | 6.3% | 17 |
| Utah | $2,703 | $843 | ($833) | (49.7%) | 31 |
| Vermont | $356 | $570 | ($1,106) | (66.0%) | 46 |
| Virginia | $62,228 | $7,290 | $5,614 | 335.0% | 1 |
| Washington | $16,157 | $2,122 | $446 | 26.6% | 13 |
| West Virginia | $1,745 | $973 | ($703) | (41.9%) | 26 |
| Wisconsin | $5,329 | $915 | ($761) | (45.4%) | 29 |
| Wyoming | $483 | $835 | ($841) | (50.2%) | 32 |
| District of Columbia | $23,945 | $33,929 | $32,253 | 1,924.4% |
Note: Does not include spending for procurement in Puerto Rico and other outlying areas.
Federal Expenditures: Wages and Salaries, FFY 2019
| Total (millions) | Per Capita | Variation from National Per Capita |
Percentage Variation from National Per Capita |
Rank (per capita) | |
|---|---|---|---|---|---|
| National: 50 States & D.C. | $273,462 | $833 | |||
| Alabama | $4,686 | $956 | $123 | 14.7% | 17 |
| Alaska | $2,509 | $3,430 | $2,597 | 311.7% | 2 |
| Arizona | $4,901 | $673 | ($160) | (19.2%) | 29 |
| Arkansas | $1,493 | $495 | ($338) | (40.6%) | 36 |
| California | $26,146 | $662 | ($171) | (20.6%) | 30 |
| Colorado | $6,283 | $1,091 | $258 | 31.0% | 11 |
| Connecticut | $1,359 | $381 | ($452) | (54.3%) | 43 |
| Delaware | $614 | $631 | ($203) | (24.3%) | 32 |
| Florida | $12,824 | $597 | ($236) | (28.3%) | 33 |
| Georgia | $11,103 | $1,046 | $213 | 25.5% | 13 |
| Hawaii | $5,811 | $4,104 | $3,271 | 392.6% | 1 |
| Idaho | $1,027 | $574 | ($259) | (31.0%) | 34 |
| Illinois | $5,900 | $466 | ($368) | (44.1%) | 38 |
| Indiana | $2,341 | $348 | ($485) | (58.3%) | 46 |
| Iowa | $931 | $295 | ($538) | (64.6%) | 48 |
| Kansas | $3,083 | $1,058 | $225 | 27.0% | 12 |
| Kentucky | $4,333 | $970 | $137 | 16.4% | 15 |
| Louisiana | $3,201 | $688 | ($145) | (17.4%) | 28 |
| Maine | $1,167 | $868 | $35 | 4.2% | 21 |
| Maryland | $17,884 | $2,958 | $2,125 | 255.1% | 3 |
| Massachusetts | $3,076 | $446 | ($387) | (46.4%) | 40 |
| Michigan | $2,930 | $293 | ($540) | (64.8%) | 49 |
| Minnesota | $1,931 | $342 | ($491) | (58.9%) | 47 |
| Mississippi | $2,468 | $829 | ($4) | (.5%) | 22 |
| Missouri | $4,315 | $703 | ($130) | (15.6%) | 27 |
| Montana | $1,026 | $960 | $127 | 15.2% | 16 |
| Nebraska | $1,450 | $750 | ($83) | (10.0%) | 25 |
| Nevada | $1,998 | $649 | ($184) | (22.1%) | 31 |
| New Hampshire | $501 | $369 | ($464) | (55.7%) | 44 |
| New Jersey | $3,261 | $367 | ($466) | (55.9%) | 45 |
| New Mexico | $2,766 | $1,319 | $486 | 58.3% | 6 |
| NEW YORK | $7,958 | $409 | ($424) | (50.9%) | 42 |
| North Carolina | $11,456 | $1,092 | $259 | 31.1% | 10 |
| North Dakota | $1,027 | $1,348 | $515 | 61.8% | 5 |
| Ohio | $5,409 | $463 | ($370) | (44.5%) | 39 |
| Oklahoma | $4,390 | $1,109 | $276 | 33.2% | 9 |
| Oregon | $1,866 | $442 | ($391) | (46.9%) | 41 |
| Pennsylvania | $5,974 | $467 | ($366) | (44.0%) | 37 |
| Rhode Island | $987 | $931 | $98 | 11.8% | 18 |
| South Carolina | $4,480 | $870 | $37 | 4.4% | 20 |
| South Dakota | $885 | $1,001 | $167 | 20.1% | 14 |
| Tennessee | $3,394 | $497 | ($336) | (40.3%) | 35 |
| Texas | $21,460 | $740 | ($93) | (11.2%) | 26 |
| Utah | $2,574 | $803 | ($30) | (3.6%) | 24 |
| Vermont | $504 | $807 | ($26) | (3.1%) | 23 |
| Virginia | $24,993 | $2,928 | $2,095 | 251.5% | 4 |
| Washington | $9,072 | $1,191 | $358 | 43.0% | 7 |
| West Virginia | $1,636 | $913 | $80 | 9.6% | 19 |
| Wisconsin | $1,563 | $268 | ($565) | (67.8%) | 50 |
| Wyoming | $668 | $1,154 | $321 | 38.6% | 8 |
| District of Columbia | $19,849 | $28,125 | $27,292 | 3,275.8% |
Note: Does not include spending for wages and salaries in Puerto Rico and other outlying areas.
Appendix B: Methodology
The starting point for this analysis is the federal budget and its figures on total receipts and outlays in Federal Fiscal Year (FFY) 2019. Excluded are receipts and outlays for which allocations cannot be made based on readily identifiable data, or for which allocation by state is not relevant. Such receipts include the deposit of earnings from the Federal Reserve and customs duties. Spending which has not been allocated by state is primarily interest paid on the federal debt, spending for international procurement and offsets from undistributed receipts.
This analysis is confined to federal spending in and revenues from the 50 states and the District of Columbia. Because per capita figures for the District of Columbia are disproportionately large in many cases, such amounts are excluded from state rankings. The analysis does not include receipts from and expenditures in Puerto Rico, the U.S. Virgin Islands, Guam, American Samoa and other outlying areas. Almost 95 percent of federal receipts and 92 percent of expenditures are allocated by state in this report.
Revenues
Data from the Internal Revenue Service (IRS) and other federal agencies on taxes and fees collected in FFY 2019 were used as the basis for the estimates of revenues generated by each state. Sources that were used to supplement IRS data include: the Social Security Administration, for allocation of Federal Insurance Contributions Act and Self Employed Contributions Act payroll taxes; the Bureau of Economic Analysis (BEA), for data used to allocate corporate taxes based on the location of business activity; the U.S. Department of Transportation, the Federation of Tax Administrators, and the National Institute of Alcoholism and Alcohol Abuse, for allocation of excise taxes; and the U.S. Bureau of Labor Statistics, for allocation of federal employee retirement contributions.
Expenditures
Federal budget outlays in FFY 2019 were grouped into four broad categories: direct payments to or for individuals (for example, Social Security and Medicare); grants (for example, Medicaid and highway grants); procurements; and wages. Such groupings were developed using the federal budget and other federal government information on federal expenditures. Spending in these four categories and their major subcategories was then allocated by state using various sources. These included USAspending.gov; Federal Procurement Data System – Next Generation; BEA; the U.S. Census Bureau; the IRS; the federal Office of Management and Budget and the Office of Personnel Management; the federal departments of Agriculture, Defense, Labor, and Veterans Affairs; the Centers for Medicare and Medicaid Services and the Railroad Retirement Board. The Federal Funds Information for States (FFIS) master grant data base was also used as a comprehensive source for determining certain allocations to states for a range of federal grant programs.
Federal Government Receipts and Outlays, FFY 2019 - Amounts Not Allocated and Allocated in This Report - (figures in millions)
| Allocated | ||||
|---|---|---|---|---|
| Total | Not Allocable | Outside the 50 States and D.C. | 50 States and D.C. | |
| Receipts | $3,464,161 | $156,563 | $23,548 | $3,284,050 |
| Outlays | $4,448,316 | $338,116 | $29,749 | $4,080,452 |
| Deficit | ($984,155) | |||
Appendix C: Sources
United States Government
Department of Commerce
Bureau of Economic Analysis:
Regional Data, GDP & Personal Income, Annual and Quarterly Gross Domestic Product (GDP) by State available at https://apps.bea.gov/itable/iTable.cfm?ReqID=70&step=1#reqid=70&step=1&isuri=1. See also Interactive Data/Interactive Data: GDP by State at https://www.bea.gov/data/gdp/gdp-state.
Regional Data, GDP & Personal Income, Quarterly Personal Income by State. See Quarterly Personal Income by State/Personal Current Transfer Receipts (SQINC35) (Medicare benefits); and Quarterly Personal Income by State/Wages and Salaries by Industry (SQINC7) (NAICS) at https://apps.bea.gov/itable/iTable.cfm?ReqID=70&step=1#reqid=70&step=1&isuri=1. See also Interactive Data/Interactive Tables: Regional Data at https://www.bea.gov/data/income-saving/personal-income-by-state.
State Personal Income and Employment: Concepts, Data Sources, and Statistical Methods, September 2020 at https://www.bea.gov/resources/methodologies/spi and https://www.bea.gov/system/files/2020-10/SPI2019_1.pdf.
Census Bureau:
Population Division, Table 1. Annual Estimates of the Resident Population for the United States, Regions, States, and Puerto Rico: April 1, 2010 to July 1, 2019 (NST-EST2019-01), last revised December 30, 2019 at https://www.census.gov/data/tables/time-series/demo/popest/2010s-state-total.html.
2018 American Community Survey 1-Year Estimates, B14001: School Enrollment by Level of School for the Population 3 Years and Over, at https://data.census.gov/cedsci/table?q=B14001%3A SCHOOL ENROLLMENT BY LEVEL OF SCHOOL FOR THE POPULATION 3 YEARS AND OVER&g=0100000US.04000.001&tid=ACSDT1Y2018.B14001&hidePreview=true&vintage=2018.
Department of Defense
Office of the Actuary, Statistical Report on the Military Retirement System, Fiscal Year Ended September 2019; Number of Military Retirees by State as of September 30, 2019 (page 24) and Number of Military Retirees by Country as of September 30, 2019 (pages 26-28), August 2020 at https://media.defense.gov/2020/Aug/12/2002475697/-1/-1/0/MRS_STATRPT_2019_FINAL.PDF.
Defense Health Agency/Military Health System (Health.mil), Patient Numbers By State at https://health.mil/I-Am-A/Media/Media-Center/Patient-Population-Statistics/Patient-Numbers-By-State.
Department of Health and Human Services, Centers for Medicare and Medicaid Services
Early 2020 Effectuated Enrollment Snapshot (includes 2019 data), July 23, 2020 at https://www.cms.gov/CCIIO/Resources/Forms-Reports-and-Other-Resources/Downloads/Early-2020-2019-Effectuated-Enrollment-Report.pdf (for premium tax credit data).
Expenditure Reports from MBES/CBES (Medicaid Budget and Expenditure System/State Children’s Health Insurance Program Budget and Expenditure System), Financial Management Report for FY 2019 at https://www.medicaid.gov/medicaid/finance/state-expenditure-reporting/expenditure-reports/index.html.
Department of Labor
Bureau of Labor Statistics, Quarterly Census of Employment and Wages for Ownership: Federal Government and Industry: NAICS 491 Postal Service at www.bls.gov/cew/apps/data_views/data_views.htm#tab=Tables.
Employment Training Administration, ETA 2112: UI Financial Transaction Summary at https://oui.doleta.gov/unemploy/DataDownloads.asp.
Department of the Treasury, Internal Revenue Service
Statistics of Income (SOI) Tax Stats – Historic Table 2, Individual Income and Tax Data, by State and Size of Adjusted Gross Income, Tax Year 2018 at http://www.irs.gov/statistics/soi-tax-stats-historic-table-2.
Statistics of Income (SOI) Tax Stats – IRS Data Book, Table 5: Gross Collections, by Type of Tax and State, Fiscal Year 2019 and Table 8: Amount of Refunds Issued, Including Interest, by Type of Refund and State, Fiscal Year 2019 at https://www.irs.gov/pub/irs-pdf/p55b.pdf (2019 Data Book, October 1, 2018 to September 30, 2019). See also https://www.irs.gov/statistics/soi-tax-stats-Irs-data-book.
Executive Office of the President, Office of Management and Budget: President’s Budget
Analytical Perspectives, Supplemental Materials as Spreadsheets, Tables 14-3 through 14-40. 2021 Budget State-by-State Tables at https://www.whitehouse.gov/omb/analytical-perspectives/.
Historical Tables, see: Table 1.1 – Summary of Receipts, Outlays, and Surpluses or Deficits (-): 1789-2025; Table 2.1 – Receipts by Source: 1934-2025; Table 2.4 – Composition of Social Insurance and Retirement Receipts and of Excise Taxes: 1940-2025; Table 2.5 – Composition of “Other Receipts”: 1940-2025; Table 6.1 – Composition of Outlays: 1940-2025; and Table 11.3 – Outlays for Payments for Individuals by Category and Major Program: 1940-2025 at https://www.whitehouse.gov/omb/historical-tables/.
Supplemental Materials, Public Budget Database, Outlays XLSX at https://www.whitehouse.gov/omb/supplemental-materials/.
Supplemental Materials, Supporting Documents, Object Class Analysis, Fiscal Year 2021 at https://trumpwhitehouse.archives.gov/wp-content/uploads/2020/02/objclass_fy21.pdf.
Other
Beta.sam.gov, Contract Data (FPDS) Reports, Geographical Report by Place of Performance, FY 2019 and Ad Hoc Report by Agency and State, FY 2019 at https://beta.sam.gov (site for reports from Federal Procurement Data System - Next Generation).
Department of Agriculture, Supplemental Nutrition Assistance Program (SNAP), National and/or State Level Monthly and/or Annual Data: FY69 through FY19 at https://www.fns.usda.gov/pd/supplemental-nutrition-assistance-program-snap.
Department of Transportation, Federal Highway Administration, Highway Statistics 2018, Federal Highway Trust Fund Receipts Attributable to Highway Users in Each State, Table FE-9 at https://www.fhwa.dot.gov/policyinformation/statistics/2018/fe9.cfm; and Status of the Federal Highway Trust Fund, October 1, 2017 - September 30, 2018, Table FE-10 at https://www.fhwa.dot.gov/policyinformation/statistics/2018/fe10.cfm. See also https://www.fhwa.dot.gov/policyinformation/statistics/2018/. Both tables last modified on February 19, 2020.
Department of Veterans Affairs, National Center for Veterans Analysis and Statistics, Geographic Distribution of VA Expenditures for Fiscal Year 2019, FY19 Summary of Expenditures by State, April 2020 at https://www.va.gov/vetdata/expenditures.asp.
Federal Aviation Administration, Passenger Boarding (Enplanement) and All-Cargo Data for U.S. Airports – Previous Calendar Year Data, CY 2019 at https://www.faa.gov/airports/planning_capacity/passenger_allcargo_stats/passenger/.
National Institute of Alcoholism and Alcohol Abuse, Surveillance Report #115, Table 2. Apparent alcohol consumption for States, census regions, and the United States, 2018 at https://pubs.niaaa.nih.gov/publications/surveillance115/tab2_18.htm.
Office of Personnel Management (OPM), Civil Service Retirement and Disability Program, Exhibit R14: Fiscal Year 2019 Annuitants on The Retirement Roll – CSRS/FERS Employees and Survivor Annuitants: Geographic Distribution by Number on Roll and Monthly Annuities, provided on September 1, 2020.
Railroad Retirement Board, Annual Railroad Retirement Act and Railroad Unemployment Insurance Act Data, Statistical Tables, Section A – Financial Statistics, Table A6.– Retirement, survivor, unemployment, and sickness benefit payments, by class of benefit and state of residence of beneficiary, fiscal year 2019 (In thousands), cash basis at https://www.rrb.gov/FinancialReporting/FinancialActuarialStatistical/Annual.
Social Security Administration, Earnings and Employment Data for Workers Covered Under Social Security and Medicare, by State and County, 2017 at https://www.ssa.gov/policy/docs/statcomps/eedata_sc/2017/.
USAspending.gov, see Award Search/Advanced Search at https://www.usaspending.gov/search.
Non-Government
Federal Funds Information for States, FFIS Grants Database at www.ffis.org/database.
Orzechowski and Walker, The Tax Burden on Tobacco, Volume 51, 1970-2018, Table 11, State Tax-Paid Cigarette Sales at https://chronicdata.cdc.gov/Policy/The-Tax-Burden-on-Tobacco-1970-2018/7nwe-3aj9.