

Economic and Policy Insights
Upstate Transportation Authorities Suffer Revenue Plunge
August 24, 2021
The COVID-19 pandemic created unprecedented challenges for the State’s regional transportation authorities by disrupting operations, decreasing ridership, and severely reducing revenues; however, these authorities reported that federal aid helped them weather pandemic deficits. If ridership continues to languish and does not return to pre-pandemic levels, the authorities will need additional revenue from other sources to continue to provide services at current levels—or may be faced with limiting services.
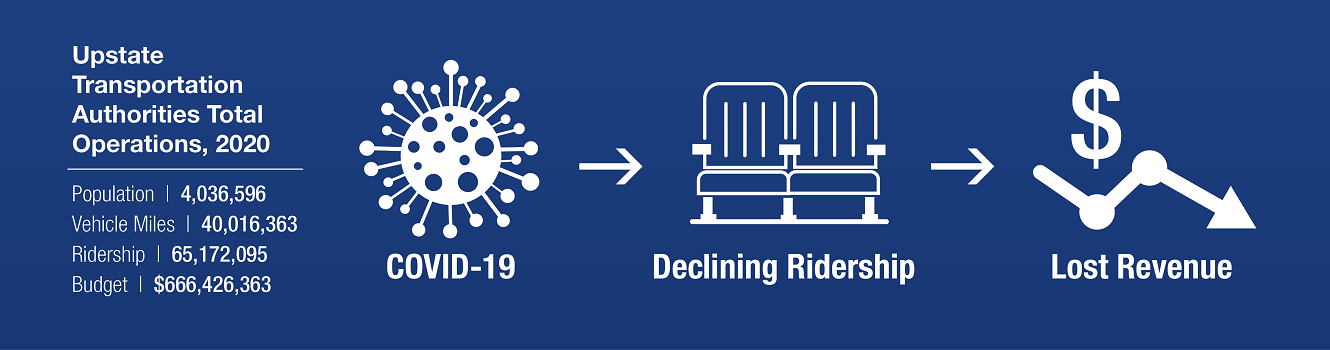
Regional transportation authorities provide public transportation in four upstate areas of New York State.1 Combined, the Capital District Transportation Authority (CDTA), the Central New York Regional Transportation Authority (CNYRTA), the Rochester-Genesee Regional Transportation Authority (RGRTA) and the Niagara Frontier Transportation Authority (NFTA) serve more than four million people residing in 18 counties. All four authorities provide bus and paratransit services, and all but RGRTA provide parking services. In addition, NFTA provides light rail and air travel, and CDTA administers bicycle and scooter rentals. Ridership totaled more than 65 million across all four authorities in 2020. (See Figures 1 and 2.)
Figure 1: State Regional Transportation Authorities – 2020 Operations
| Authority | Regional Population |
Annual Vehicle Miles |
Ridership | Operating Budget |
|---|---|---|---|---|
| Capital District Transportation Authority | 849,382 | 10,000,000 | 15,266,694 | $125,538,267 |
| Central New York Regional Transportation Authority | 882,899 | 5,550,000 | 11,000,000 | $124,923,243 |
| Niagara Frontier Transportation Authority | 1,127,983 | 13,005,600 | 23,841,188 | $285,933,000 |
| Rochester-Genesee Regional Transportation Authority | 1,176,332 | 11,460,763 | 15,064,213 | $130,031,853 |
| Total | 4,036,596 | 40,016,363 | 65,172,095 | $666,426,363 |
Sources: U.S. Census 2019; CDTA, CNYRTA, NFTA and RGRTA; Public Authorities Reporting Information System (PARIS)
Figure 2: State Regional Transportation Authorities – Areas and Services
Sources: U.S. Census 2019; CDTA, CNYRTA, NFTA and RGRTA; PARIS
All four authorities are highly reliant on subsidies. State subsidies account for more than 50 percent of total revenues at CNYRTA and nearly 46 percent at RGRTA. State and federal subsidies combined comprise 71 percent and 42 percent of CDTA and NFTA total revenues, respectively. NFTA also receives a sizable municipal subsidy from sales tax receipts collected by Erie County. For each authority, Figure 3 shows the percentage of revenue by source in the fiscal year that ended March 31, 2020 (FY 2020), before COVID-19 affected operations.
Figure 3: Authority Revenues by Source, FY 2020
Notes: Other includes municipal and public authority subsidies, investment earnings, rental and financing income and other operating and non-operating revenues. Numbers may not add due to rounding.
Source: PARIS
Pandemic Effects
New York State law and regulations require public authorities to file reports detailing their operations, including financial, procurement, staffing and other information annually in the Public Authorities Reporting Information System (PARIS).2 If a State public authority suffers an adverse, material impact to its finances, it is also required to file a Budget Impact Statement (BIS).3 Collectively, these reports for the year ended March 31, 2021 provide valuable insight into the impacts of the pandemic. All four regional transportation authorities suffered ridership and fare losses, as well as a reduction in State funding. The authorities also reported that additional federal aid helped mitigate pandemic deficits.
Loss of Revenue and Ridership
Regional transportation authorities stopped collecting passenger bus fares in the spring of 2020 in order to distance drivers from passengers during the height of the pandemic. In addition, CDTA temporarily closed the Saratoga Springs Rail Station and NFTA suspended the collection of fares on its Metro Rail service. Fare collection resumed in the summer of 2020. Additionally, authorities reduced routes during the pandemic and have not yet added all routes back. Collectively, the authorities reported ridership declines from FY 2020 to FY 2021 that ranged from 35.5 percent at CDTA to 70.4 percent at CNYRTA. (See Figure 4.)
Figure 4: Regional Transportation Authorities – Annual Ridership, FY 2020 and FY 2021 (in millions)
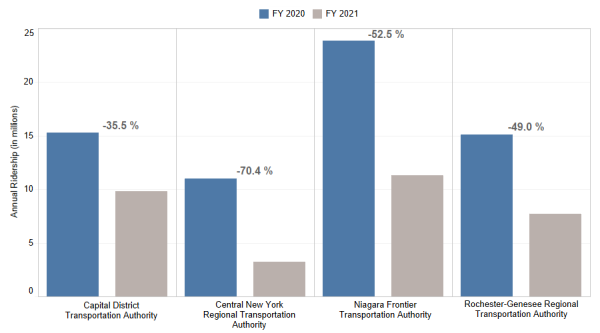
Sources: CDTA, CNYRTA, NFTA and RGRTA
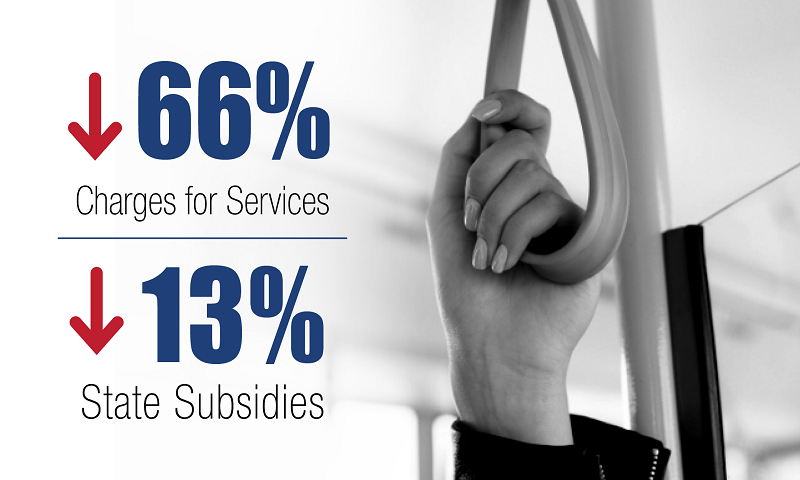
Ridership declines translated directly to decreases in revenues from charges for services. On a combined basis, the four regional transportation authorities reported ridership declines of 33.1 million (50.7 percent) and declines in charges for services, which includes passenger fare revenue, of $81.7 million (65.9 percent) from the prior year.
Of the four authorities, RGRTA had the largest percentage decline (82.2 percent) in charges for services revenue due to the loss of special fare revenue from contracts with businesses and organizations in the service area. (See Figure 5.) NFTA, where charges for services revenue declined by 65.3 percent, suffered the largest dollar decrease of $42.2 million, which included the loss of parking, food and retail revenue at Buffalo Niagara and Niagara Falls International Airports due to travel restrictions and the closure of the Canadian border. For all four authorities combined, revenue from charges for services made up 21.8 percent of total revenue in FY 2020 and dropped sharply to 6.8 percent of total revenue in FY 2021.
Figure 5: Regional Transportation Authorities – Percentage Change in Charges for Services and State Subsidies, FY 2021
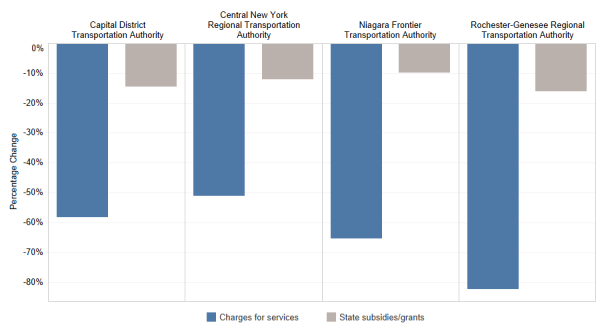
Source: PARIS
Declines in State subsidies were less severe: State funding reported by all four authorities combined decreased by $25 million or 12.9 percent in FY 2021. New York State withheld certain Aid to Localities funding as it faced its own budget shortfalls. The State indicated that it would restore this funding if the federal government provided fiscal relief, yet regional transportation authorities still reported a year-over-year decline in State support. RGRTA suffered the largest percentage decline in State revenue at 16.0 percent, as well as the largest dollar decrease at $7.4 million.
Emergency Federal Aid Offset Other Revenue Losses
Emergency federal aid appropriated through the Coronavirus Aid, Relief, and Economic Security Act (CARES Act) and other legislation provided additional funding to regional transportation authorities to offset other revenue losses. Figure 6 shows federal revenue reported by authorities in PARIS. In FY 2021, federal revenue made up 43.8 percent of total revenue for all four authorities, compared with 19.6 percent of total revenue in FY 2020. Federal aid increased by more than 100 percent for CNYRTA and NFTA and by more than 600 percent for RGRTA, while CDTA received a 40 percent increase.
Figure 6: Regional Transportation Authorities – Federal Revenue, FY 2020 and FY 2021 (in millions)
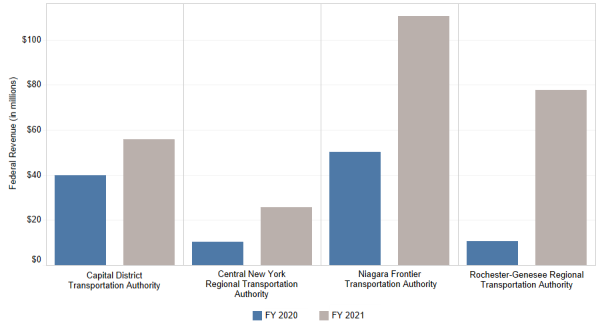
Source: PARIS
Implications for the Future
Transit authorities continue to face uncertainty regarding the timing and extent of the recovery of passenger fare revenues. Ridership has not yet returned to pre-pandemic levels. For example, in March 2021, CDTA reported 879,466 riders for the month, compared to March 2020 ridership of just over one million, and March 2019 ridership of 1.3 million.
Federal emergency financial assistance offset some revenue declines in FY 2021, and additional federal aid is expected from the American Rescue Plan Act and potentially from the infrastructure bill being considered by Congress; however, relief funding is temporary and allocations from the infrastructure bill for transit are still uncertain. If ridership does not rebound at these authorities, they may be forced to seek greater State and federal aid and/or to limit some of the critical services they provide.
New York State’s Public Authorities
To further public interests, State and local governments in New York have created entities commonly referred to as public authorities to develop, operate and maintain critical infrastructure including roads, bridges, mass transit, and environmental facilities and to finance economic and community development projects. To learn more about public authorities, visit our Public Authorities web page.
Endnotes
1 This report includes data for transportation authorities established in State law, with board members appointed by the Governor, and that have regional significance. It focuses on the State regional transportation authorities outside of the Metropolitan Commuter Transportation District in the New York City area.
2 Public authority data are self-reported and not verified by the Office of the State Comptroller.
3 New York Codes, Rules and Regulations (NYCRR) Title 2 – Part 203.8 requires State public authorities to inform the Comptroller in writing at any point during the fiscal year when the chief financial officer learns of the potential financial impact of any adverse development that would materially affect the authority’s budget or financial plan.