
Department of Environmental Conservation (DEC)
- In SFY 2020-21, DEC All Funds spending totaled $991.8 million, a decrease of $251.3 million (20.2 percent) from SFY 2019-20 due to COVID-19 related reductions in activity and spending. Compared with SFY 2019-20, spending was reduced in all areas except personal service. The largest reduction was in local assistance spending with a year-over-year reduction of 55.5 percent.
- As of March 31, 2021, employment at DEC reached 2,853 Full-Time Equivalent (FTE) positions, a reduction of 164 FTEs below levels as of March 31 in the previous year and 4.9 percent below levels from March 31, 2011.
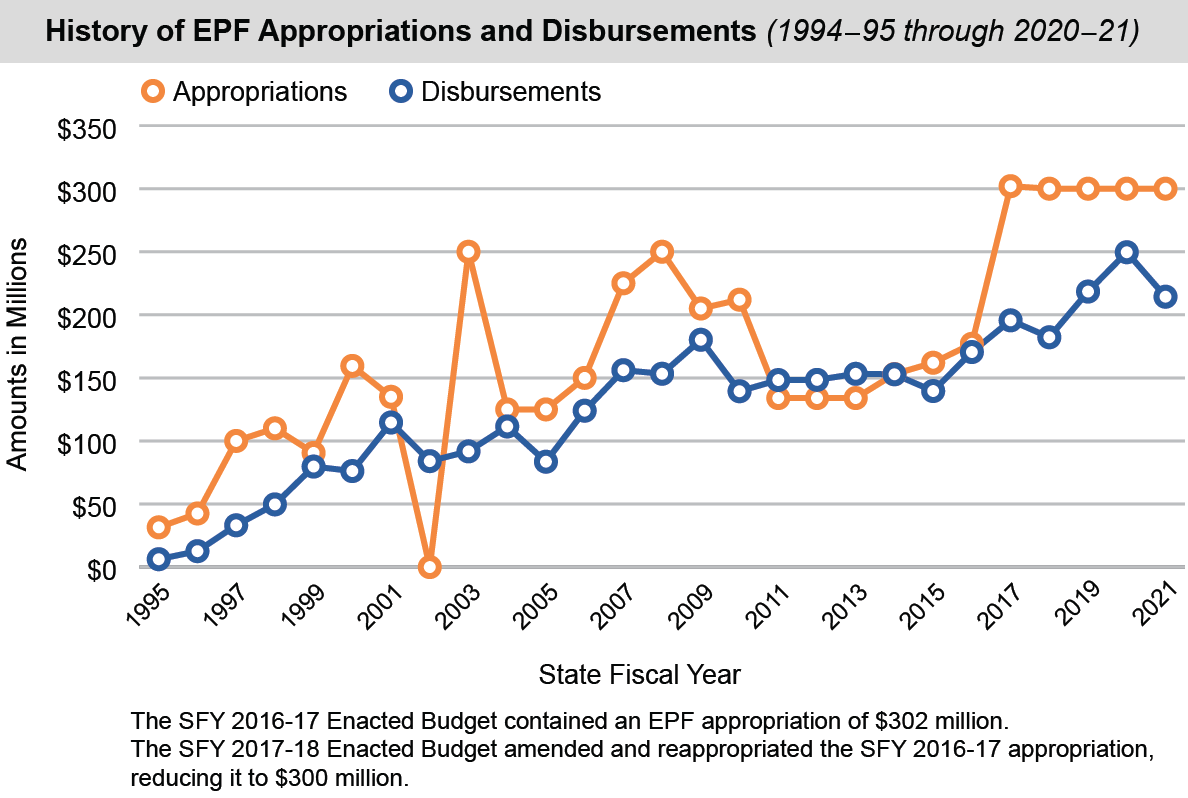
Environmental Protection Fund (EPF)
Created in 1993, the EPF:
- Provides an ongoing source of primarily pay-as-you-go funding to address the State’s environmental needs. Appropriations to the EPF have fluctuated over time and were $300 million in SFY 2020-21.
- Supports a broad array of environmental programs, such as State and municipal open space conservation; municipal and agricultural non-point source water pollution control; State and local parks projects; municipal water pollution control and aquatic habitat conservation; support for the State’s zoos, botanical gardens and aquaria; waterfront revitalization; farmland conservation; and municipal climate change mitigation and resilience programs.
- Has been primarily funded with a portion of the State’s real estate transfer tax. However, from SFY 2014-15 through SFY 2020-21, General Fund Transfers were also a recurring funding source and accounted for 24 percent of EPF funding.
Restore Mother Nature Bond Act
- The Enacted Budget for SFY 2021-22 authorized a bond act to be considered by voters at the ballot box in November of 2022 entitled the “Environmental Bond Act of 2022: Restore Mother Nature.” If approved by the voters, the ballot question would authorize the issuance of $3 billion in bonds in support of climate change mitigation, flood prevention, aquatic restoration, water quality improvement and upgrades of water infrastructure.
Air
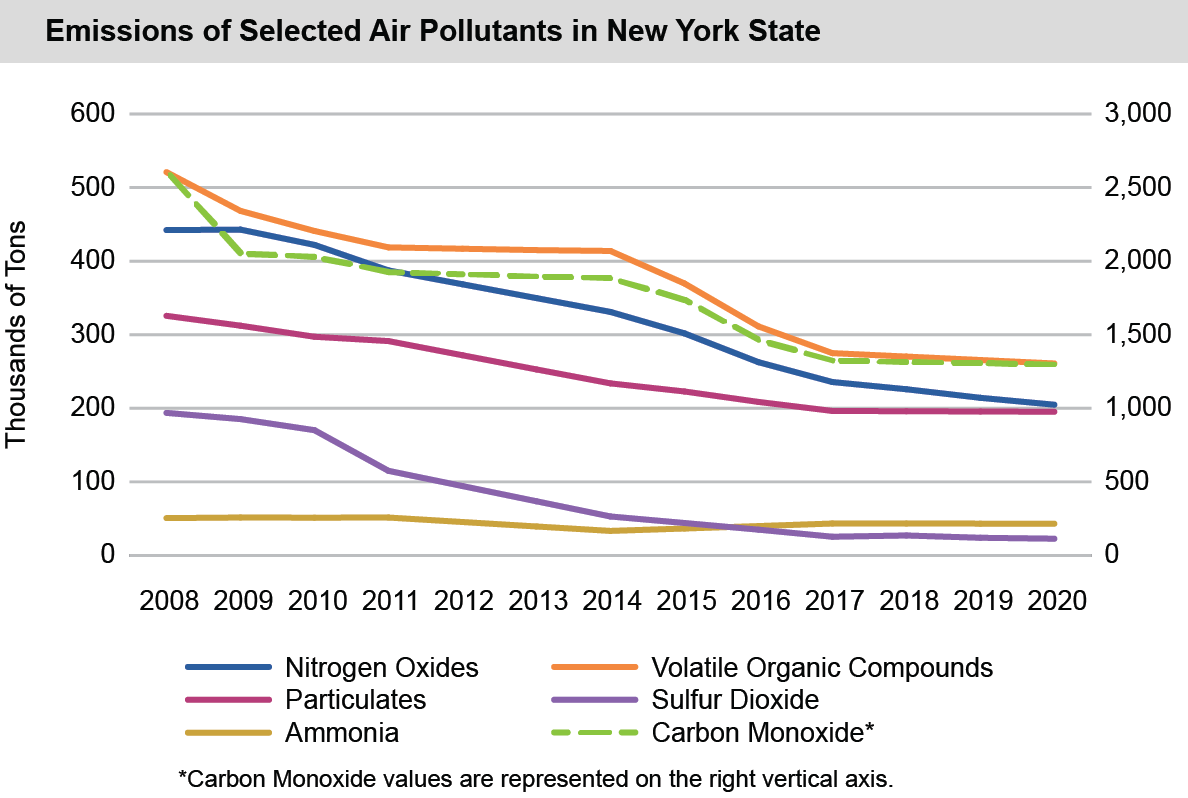
- For 2020, the U.S. Environmental Protection Agency’s State Average Annual Emissions Trend report showed estimated total emissions in New York from certain criteria pollutants covered by the National Ambient Air Quality Standards, excluding lead, of 2 million tons, a decrease of 1.2 percent from the previous year’s estimated emissions and a decrease of more than 40.6 percent from 2010. These emissions include nitrogen oxides, volatile organic compounds, particulate pollution, sulfur dioxide, carbon monoxide and ammonia. Nitrogen oxides and volatile organic compounds are precursors of ground level ozone, or smog. Sulfur dioxide is a precursor of particulate formation in the atmosphere and of acid rain. Total emissions of each pollutant and the most prominent source for each are listed below:
- Carbon monoxide – 1.3 million tons. Together, highway and off-highway vehicles accounted for 85.3 percent of carbon monoxide emissions.
- Volatile organic compounds – 260,945 tons. Industrial and commercial solvent use accounted for 42.2 percent of that total.
- Nitrogen oxides – 204,856 tons. Highway and off-highway vehicles accounted for 61.9 percent of these emissions.
- Particulates – 195,306 tons. Mining and quarrying, construction, agriculture and road dust combined produced 70.6 percent of these emissions.
- Ammonia – 43,180 tons. Agricultural livestock and fertilizer application combined accounted for 84.5 percent of this total.
- Sulfur dioxide – 22,751 tons. Fuel combustion by industry produced 51.5 percent of the total.
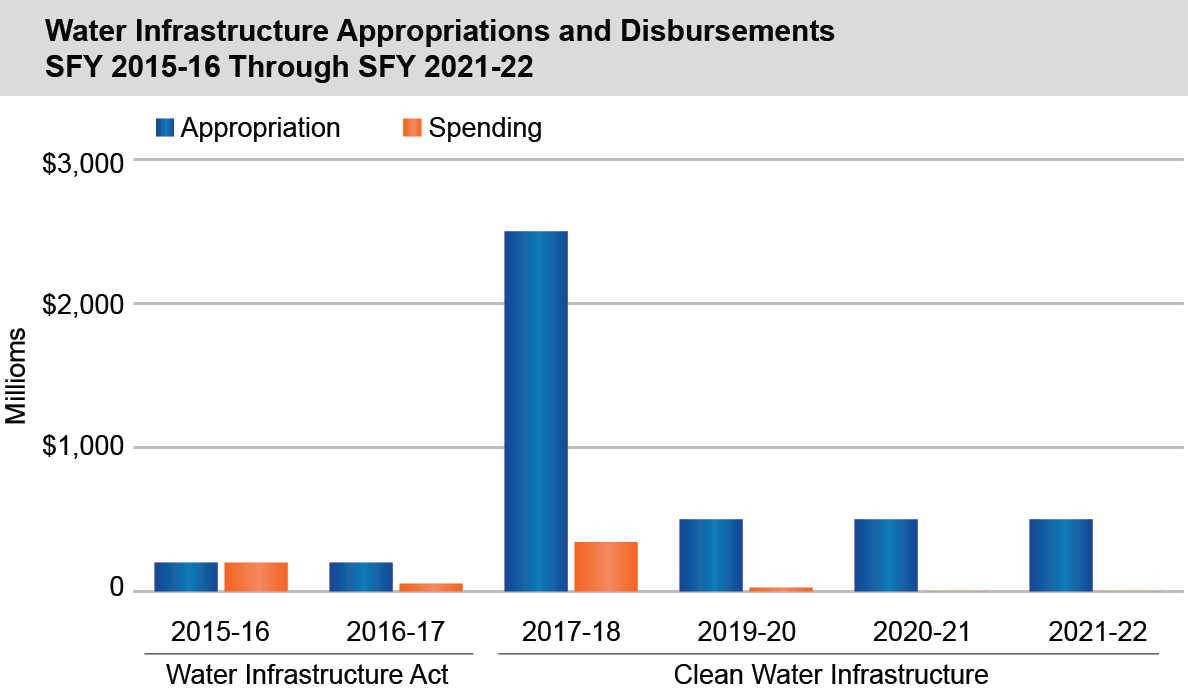
Water
- Since SFY 2015-16, Enacted Budgets have included $4.4 billion for clean water infrastructure projects, including those projects authorized by the New York State Water Infrastructure Improvement and Clean Water Infrastructure Improvement Acts. Eligible projects include nonagricultural nonpoint source control; municipal wastewater treatment; remediation of contaminated sites that contribute to water contamination; source water protection; and upgrades to septic systems and cesspools. As of March 31, 2021, $625.5 million (14.2 percent) had been spent from these appropriations.
- In 2020, there were reported incidences of harmful algal blooms (HAB) on 184 bodies of water in New York State, a decrease of four from the prior year. HABs lead to reduced oxygen in the water and produce toxins that can make it unsuitable for use as a surface drinking water supply. Of the affected water bodies:
- 53.3 percent experienced more than one HAB event;
- 4.3 percent experienced between 10 and 20; and
- 6.0 percent experienced 20 or more.
Cayuga Lake, in the Finger Lakes region, had the largest number of observed HAB events, with 94.
- According to the DEC in 2016:
- Approximately 25 percent of assessed river and stream miles in the state are impaired or suffer minor impacts or threats.
- Nearly 31 percent of assessed lakes and reservoirs are impaired or suffer minor impacts or threats.
- About 62 percent of the state’s estuary waters are impaired, as are the entire state Great Lakes shoreline and 2 percent of the Atlantic Ocean coastline.
Solid Waste
- According to the DEC in 2018:
- A total of 39.1 million tons of waste were generated in New York State including:
- 18.3 million tons of municipal solid waste;
- 15.4 million tons of construction and demolition debris;
- 2.6 million tons of industrial wastes; and
- 2.8 million tons of biosolids.
- Of these wastes:
- 14.3 million tons were landfilled;
- 14.0 million tons were recycled;
- 7.5 million tons were exported for disposal; and
- 3.3 million tons were incinerated.
- A total of 39.1 million tons of waste were generated in New York State including:
Energy
- Legislation to streamline and expedite the siting of major renewable energy projects was enacted in the SFY 2020-21 Enacted Budget. The legislation moves permitting of certain renewable energy facilities from the Public Service Commission to the Department of State and sets a deadline of one year for permit decisions. Eligible renewable energy facilities include those capable of generating 20 megawatts or more of electricity using the following technologies:
- Solar thermal
- Photovoltaic
- Land-based and offshore wind
- Hydroelectric
- Geothermal electric
- Geothermal ground source heat
- Tidal energy
- Wave energy
- Ocean thermal
- Fuel cells relying on fuels other than fossil fuel
- Legislation creating a statewide standard for establishing the assessed value of solar and wind energy systems and strict notice requirements for municipalities requiring payments in lieu of taxes from these facilities was included in the SFY 2021-22 Enacted Budget.
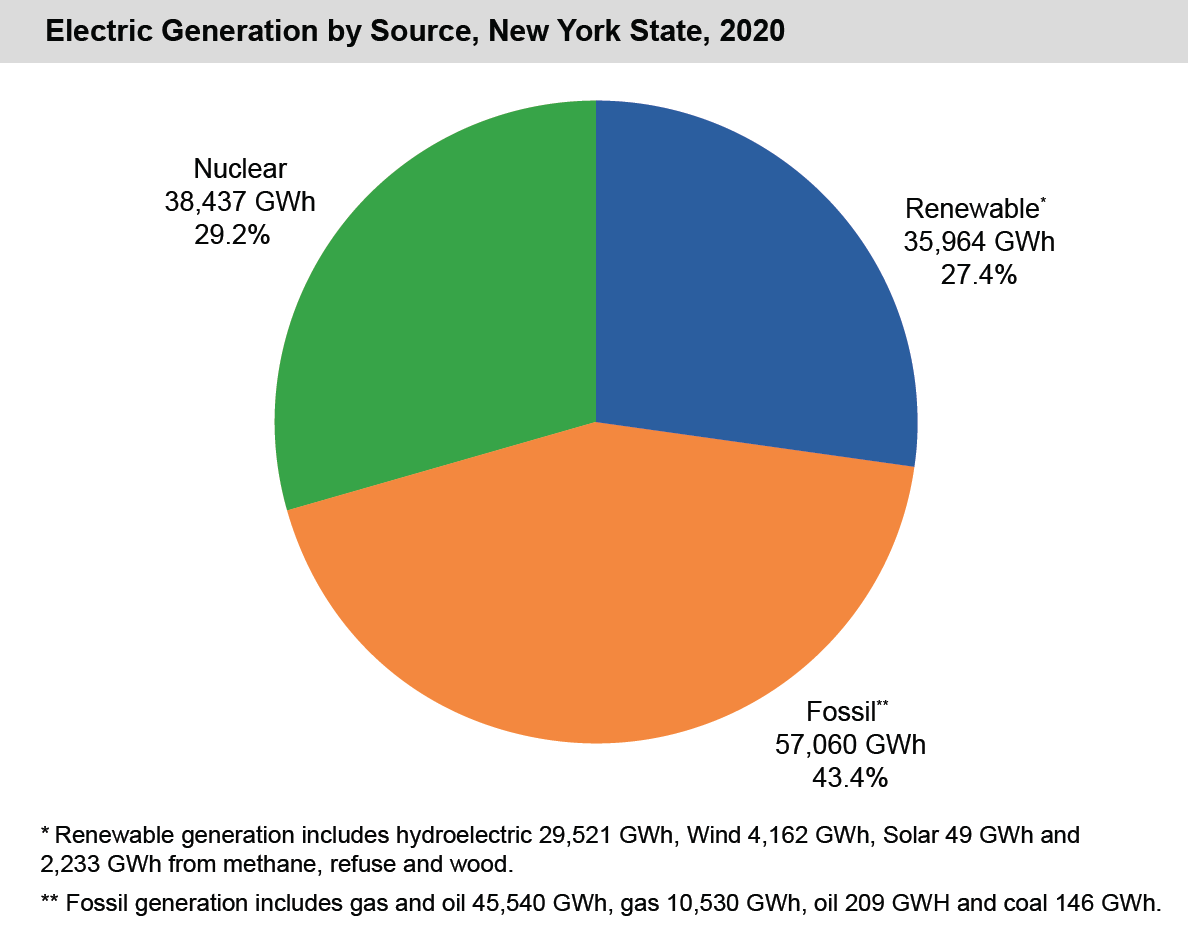
- According to the New York State Independent System Operator, in 2020, 131,461 gigawatt hours (GWh) of electricity were generated in New York State. Of this electricity:
- 35,964 GWh (27 percent) was produced from renewable fuels;
- 38,437 GWh (29 percent) was produced from nuclear fuels; and
- 57,060 GWh (43 percent) was produced from fossil fuels.
Renewable generation includes hydroelectric (29,521 GWh), wind (4,162 GWh), 2,233 GWh from methane, refuse and wood, and solar (49 GWh). Fossil generation includes gas and oil (45,540 GWh), gas (10,530 GWh), oil (209 GWH) and coal (146 GWh).
According to the U.S. Energy Information Administration:
- In 2018, New York State emitted 167.5 million metric tons of carbon dioxide due to energy use, or 19.7 percent lower than 1990 levels.
- In 2017, New York State had the most energy efficient economy among U.S. states, consuming 2.6 thousand BTUs for every dollar of gross domestic product.
- In 2018, with energy consumption of 197 BTU per person, New York State had the second lowest per capita energy consumption of any state.
- For March 2021, New York State’s average residential natural gas price of $11.54 per thousand cubic feet was 18th in the nation. The commercial average natural gas price for March was $7.71 per thousand cubic feet.
- For April 2021, at 18.05 cents per kilowatt hour, New York State’s average residential electric rate was ninth in the nation. At 15.85 cents per kilowatt hour, New York State’s average commercial electric rate was seventh in the nation.
Agriculture
According to the U.S. Department of Agriculture, in 2020:
- There were 33,400 farms in New York State encompassing 6.9 million acres, with an average farm area of 207 acres.
- At $3,150 per acre, New York had the second lowest average value for farmland among Northeastern states—only Maine’s value was lower.
According to the U.S. Department of Agriculture, in 2019:
- The overall economic impact from New York farms as measured by net farm income was $1.9 billion, an increase of more than 45 percent from 2018.
- Receipts from the sale of all agricultural commodities in New York State were approximately $5.3 billion.
- With total receipts of $276.2 million, New York was the second largest apple producer in the nation.
- New York was the fourth largest milk producer in the nation, with total sales of $2.8 billion.