This Google™ translation feature is provided for informational purposes only.
The New York State Office of the State Comptroller's website is provided in English. However, the "Google Translate" option may help you to read it in other languages.
Google Translate™ cannot translate all types of documents, and it may not give you an exact translation all the time. If you rely on information obtained from Google Translate™, you do so at your own risk.
The Office of the State Comptroller does not warrant, promise, assure or guarantee the accuracy of the translations provided. The State of New York, its officers, employees, and/or agents are not liable to you, or to third parties, for damages or losses of any kind arising out of, or in connection with, the use or performance of such information. These include, but are not limited to:
damages or losses caused by reliance upon the accuracy of any such information
damages incurred from the viewing, distributing, or copying of such materials
Because Google Translate™ is intellectual property owned by Google Inc., you must use Google Translate™ in accord with the Google license agreement, which includes potential liability for misuse: Google Terms of Service.
2022 Financial Condition Report For Fiscal Year Ended March 31, 2022
Significant Federal Aid Continues to Support New York Schools
According to the Division of the Budget, schools have received or are slated to receive $15.3 billion from various federal aid programs, including $1.6 billion from the Coronavirus Aid, Relief, and Economic Security Act (CARES Act), $4.4 billion from the Coronavirus Response and Relief Supplemental Appropriations Act (CRRSA Act), and $9.3 billion from the American Rescue Plan Act (ARP Act). Federal pandemic relief for K-12 education is expected to run through SFY 2024-25.
In SFY 2021-22, $2 billion of federal COVID-19 recovery funding was disbursed to New York school districts, an amount equal to 7.1 percent of State funding levels for the same period.
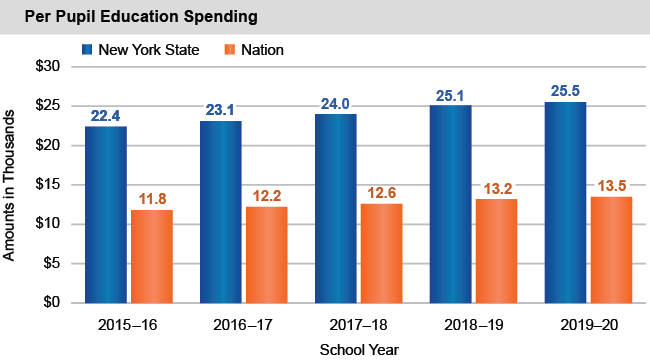
New York State Ranks Highest in Nation in Per Pupil Spending
For the 2019-20 school year (SY), the most recent year for which data are available, New York State led all states in per-pupil disbursements for public elementary and secondary education at $25,519 according to the U.S. Census Bureau. New York’s per-pupil spending rose 1.6 percent from the previous year and is 89 percent greater than the national average. Differences in educational spending among states may reflect variations in student profiles and regional costs, among other factors.
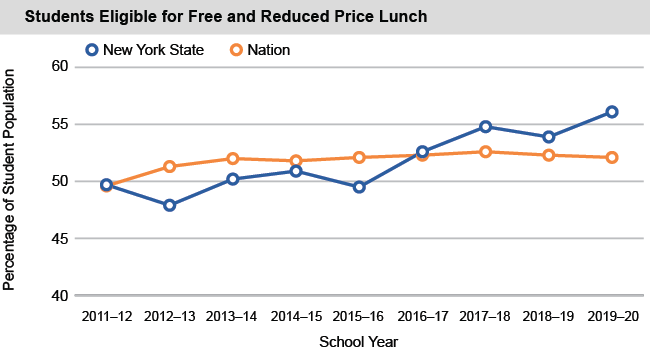
In SY 2019-20, 56.1 percent of K-12 students were certified for free and reduced-price school meals based on household income, higher than the national average (52.1 percent).
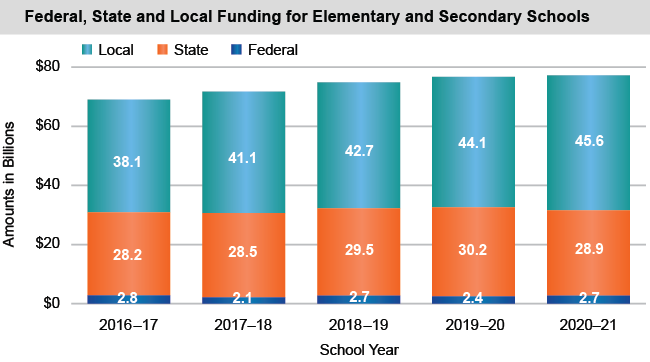
Local Resources Represent the Largest Source of Funding
In SY 2020-21, support for public elementary and secondary schools in New York came from the following sources:
Local, $45.6 billion;
State, $28.9 billion, including the School Tax Relief Program (STAR) of $2 billion; and
Federal, $2.7 billion.
In school budgets proposed for SY 2022-23, property tax levy increases averaged 1.7 percent, compared to a 1.4 percent increase the previous year. The number of voters increased by approximately 120,000 for SY 2022-23 budget votes with seven districts failing on the first try, compared to five last year.
Student Performance
Overall graduation rates have steadily increased since SY 2016-17 in New York. However, the rate of students receiving a Regents diploma is steadily declining over the same period.
New York’s fourth grade students scored slightly below the national average on the National Assessment for Education Progress (NAEP) math test in 2019 and ranked 40th in the nation. Eighth graders in New York also scored slightly below the national average, but ranked 27th in the nation.