This Google™ translation feature is provided for informational purposes only.
The New York State Office of the State Comptroller's website is provided in English. However, the "Google Translate" option may help you to read it in other languages.
Google Translate™ cannot translate all types of documents, and it may not give you an exact translation all the time. If you rely on information obtained from Google Translate™, you do so at your own risk.
The Office of the State Comptroller does not warrant, promise, assure or guarantee the accuracy of the translations provided. The State of New York, its officers, employees, and/or agents are not liable to you, or to third parties, for damages or losses of any kind arising out of, or in connection with, the use or performance of such information. These include, but are not limited to:
damages or losses caused by reliance upon the accuracy of any such information
damages incurred from the viewing, distributing, or copying of such materials
Because Google Translate™ is intellectual property owned by Google Inc., you must use Google Translate™ in accord with the Google license agreement, which includes potential liability for misuse: Google Terms of Service.
2022 Financial Condition Report For Fiscal Year Ended March 31, 2022
Major Local Revenue Sources Remained Fairly Stable
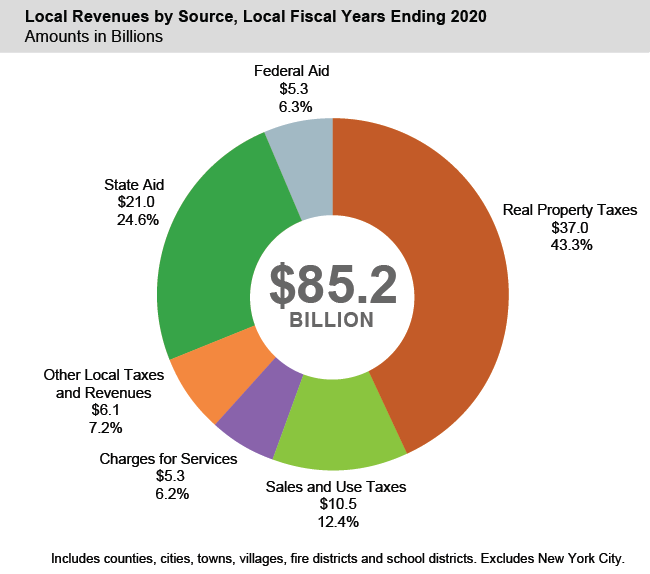
Real property tax revenues were mostly unaffected by COVID-19 in local fiscal years ending (LFY) in 2020. As the single largest source of revenue for local governments, real property taxes accounted for $37 billion, or 43.3 percent, of total revenue ($85.2 billion) for local governments not including New York City.
School districts and towns received $23.4 billion and $4.3 billion, respectively, in real property taxes, representing over 53 percent of total revenue for each class; villages received $1.4 billion (47.5 percent) and fire districts, which are the class most dependent on real property taxes, received $803 million (91 percent). Counties are least reliant on property taxes, which represent 23 percent ($5.8 billion) of total revenue.
State aid, despite some temporary reductions in LFY 2020 (mostly restored in LFY 2021), remained the next largest source of revenue. School districts are the most dependent on State aid, as it represents almost 38 percent ($16.5 billion) of total revenue. State aid also represents a significant share of revenues for other local governments—for social service programs in counties, for highways (mostly in cities and towns) and as unrestricted municipal aid (mainly in cities).
Sales and use taxes, the next largest local source of revenue for local governments, were the most negatively impacted in LFY 2020, dropping 4 percent over LFY 2019. Even so, they represented $10.5 billion, or 12.4 percent, of total revenue and remained the largest single revenue source for counties (33.6 percent in LFY 2020).
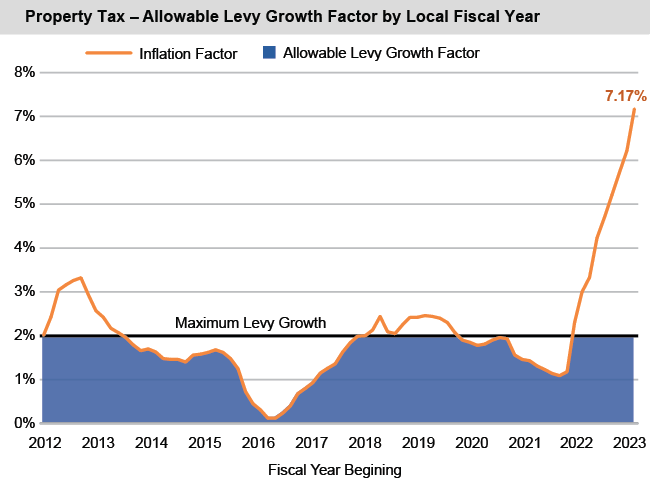
Property Tax – Allowable Levy Growth Is Increasing Again After a Decline
Generally, the property tax cap limits levy increases to the lesser of 2 percent or the rate of inflation, with some exceptions, though each local government’s tax cap calculation involves a multi-step formula. The law also includes provisions for a local government to override the tax cap.
Low inflation just before and during the early part of the pandemic reduced the allowable levy growth rate for local governments in local fiscal years beginning in 2020 and 2021, with a few exceptions, to below 2 percent. However, as inflation began to rise in 2021 and accelerate into 2022, the allowable levy growth rate returned to the maximum allowable (2 percent) starting with local fiscal years beginning in 2022.
The inflation factor for local governments with a calendar fiscal year in 2023 is 7.17 percent. This is the highest the inflation factor has been since the tax cap was first implemented and more than triple the 2.3 percent inflation factor from the prior year. The combination of high inflation and the 2 percent tax cap may create budgetary challenges for local governments.
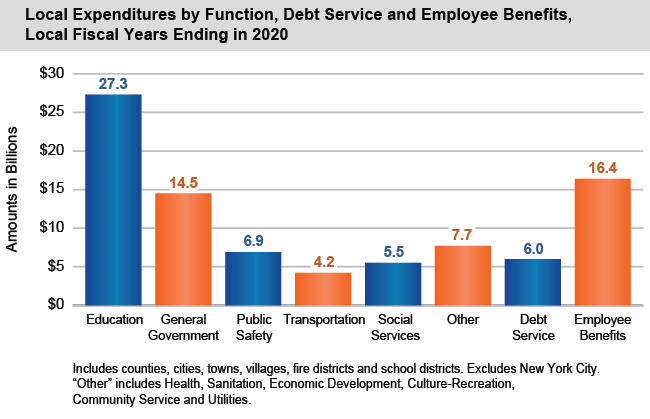
Education and Employee Benefits Account for Half of Local Expenditures
Local expenditures totaled $88.5 billion in LFY 2020. School districts spent the most at $45.5 billion, followed by counties ($25.3 billion), towns ($8.5 billion), cities ($5.1 billion), villages ($3.2 billion) and fire districts ($853 million).
COVID-19 reduced many local government expenditures, often as a result of the closure of buildings (including school buildings) or programs (such as municipal swimming pools and summer camps).
Overall, education made up almost 31 percent of total expenditures in LFY 2020. Nearly all of this (96 percent) was school district spending on elementary and secondary education, with most of the rest being county expenditures on higher education. Education spending was down 0.3 percent in LFY 2020, largely due to COVID-19-related school closures at the end of the year.
The next largest area of expenditures was employee benefits, which accounted for 18.6 percent ($16.4 billion) of total spending. Although this dropped slightly (-0.7 percent) from LFY 2019 to LFY 2020, it has been the fastest growing area of expenditure historically, increasing at an average annual rate of 3.3 percent from LFY 2010 to LFY 2020, nearly twice the rate of growth in total expenditures (1.7 percent).
Fiscal Stress Slightly Down in Local Fiscal Years Ending in 2020
The Office of the New York State Comptroller analyzes the financial condition of each municipality and school district through its Fiscal Stress Monitoring System (FSMS), which combines several financial indicators into an overall score intended to measure each entity’s budgetary solvency.
As noted above, some local government revenues were negatively affected during the COVID-19 pandemic, including sales tax collections, some State aid payments and certain fee and fine revenues. The pandemic also caused a number of operational changes, as local governments closed public buildings, courts and recreational programs in the spring and summer of 2020, and school districts scrambled to provide services virtually from mid-March through the end of the school year in June. In many cases, building and recreational program closures resulted in net savings to local governments.
Although LFY 2020 presented extraordinary challenges to many local governments and school districts in particular, the net effect of these changes did not increase fiscal stress levels in FSMS. A total of 61 local governments, including 31 school districts, were in some fiscal stress designation in LFY 2020, somewhat fewer than in LFY 2019.