
New York’s Economy and Finances in the COVID-19 Era
April 16, 2021 Edition
Analysis of the Paycheck Protection Program in New York
The Paycheck Protection Program (PPP) is a loan program administered by the U.S. Small Business Administration (SBA) first authorized by Congress in March 2020 to respond to the economic hardships faced by small businesses and not-for-profit organizations due to the pandemic. It provides low-interest loans for payroll and other qualified expenses, such as rent and utility payments. The loan can be forgiven if the business maintains employment levels and meets other conditions, essentially turning the loan into a grant. The program was initially funded at $349 billion. Subsequent reauthorizations modified requirements and eligibility, and added $320 billion in April and $284 billion in December 2020. The American Rescue Plan Act (ARP) of 2021, signed into law in March 2021, added $7.25 billion for a total authorization of $960.3 billion. The ARP also expanded eligibility to nonprofits that have more than 500 employees. Eligible entities can apply for a PPP loan until May 31.
SBA reporting for the first three rounds of funding through April 11, 2021, indicates $755 billion in loans have been approved for 9.6 million borrowers across the country. Detailed data are available for $679 billion in loans made through the end of February. Below are the key findings for New York and the figures presenting the data, which are also available as a printable PDF.
- New York entities received 489,100 loans totaling $51.0 billion, or 7.5 percent of the total nationwide loan amount. Only California and Texas received more.
- Most of the loans were made to entities downstate: 47 percent of borrowers were located in New York City and an additional 24 percent were located in Westchester, Suffolk, and Nassau counties, reflecting both population patterns and the early and severe impact of the pandemic in these regions. For a detailed analysis of PPP loans in New York City, read the Comptroller’s report.
- The average loan was $104,200, ranging from a low of $50,300 on average in Greene County to a high of $153,600 on average in Manhattan (New York County). The median loan was about $86,800.
- More than 90 percent of the loans went to businesses with less than 25 employees, with an average loan size of approximately $45,700. While just 0.5 percent of loans went to entities with 250 to 500 employees, these entities had higher average loans — $2.7 million— and comprised one-eighth of total loan value.
- The greatest number and value of loans, approximately 14 percent, went to businesses in the professional, scientific, and technical services industry. Other industries with a high share of loan value were health care and social assistance (13 percent) and construction (12 percent). While both the accommodation and food services sector and the arts, entertainment, and recreation sector were particularly hard hit by the pandemic, accommodation and food services received a greater share of loans (9 percent of loans, 11 percent of value) than arts, entertainment and recreation (3 percent of loans, 2 percent of value).
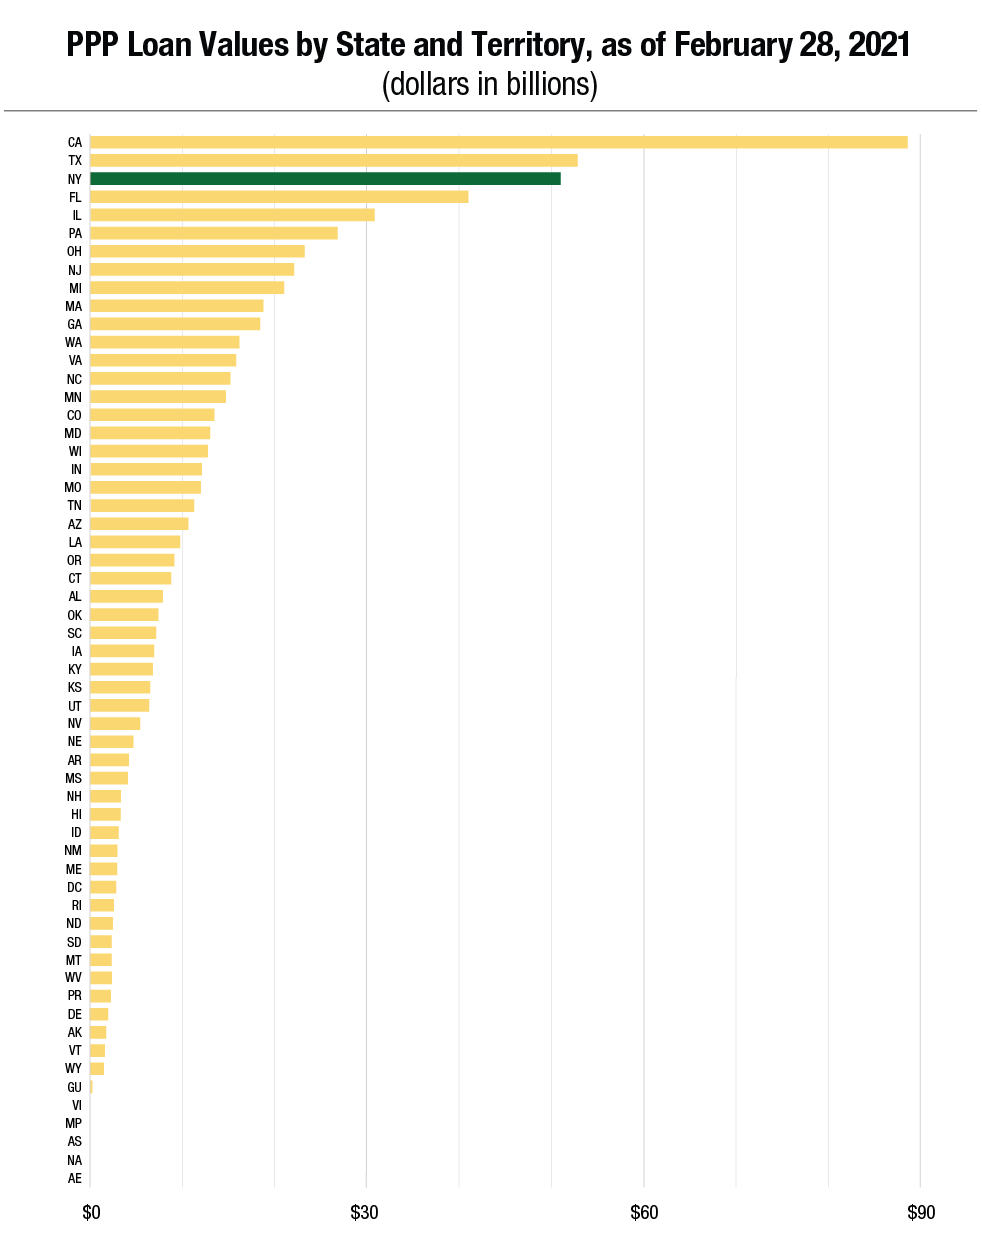
Source: U.S. Small Business Administration
Data accessed on March 25, 2021, for the period ending February 28, 2021.
- Breakdown of PPP Loans in New York State
-
Number and Value of PPP Loans Approved in New York by County
(as of February 28, 2021)County Number of Loans Value of Loans Average Loan ALBANY 6,794 $887,784,570 $130,672 ALLEGANY 394 $37,304,836 $94,682 BRONX 16,667 $1,354,373,882 $81,261 BROOME 3,145 $343,539,232 $109,233 CATTARAUGUS 1,072 $89,465,048 $83,456 CAYUGA 1,282 $139,393,073 $108,731 CHAUTAUQUA 1,889 $201,377,160 $106,605 CHEMUNG 1,253 $156,128,178 $124,603 CHENANGO 572 $53,539,123 $93,600 CLINTON 1,196 $124,231,178 $103,872 COLUMBIA 1,548 $115,464,785 $74,590 CORTLAND 825 $84,608,915 $102,556 DELAWARE 698 $47,869,483 $68,581 DUTCHESS 6,448 $552,642,650 $85,708 ERIE 19,082 $2,317,746,026 $121,462 ESSEX 800 $64,820,253 $81,025 FRANKLIN 637 $46,786,460 $73,448 FULTON 642 $64,565,308 $100,569 GENESEE 971 $100,262,711 $103,257 GREENE 1,024 $51,457,274 $50,251 HAMILTON 100 $7,592,381 $75,924 HERKIMER 740 $60,027,794 $81,119 JEFFERSON 2,020 $175,474,625 $86,869 KINGS 62,865 $4,753,156,575 $75,609 LEWIS 288 $17,941,543 $62,297 LIVINGSTON 981 $84,820,098 $86,463 MADISON 941 $84,488,118 $89,785 MONROE 15,545 $1,803,352,880 $116,009 MONTGOMERY 662 $70,364,682 $106,291 NASSAU 47,469 $4,502,379,880 $94,849 NEW YORK 91,821 $14,108,227,476 $153,649 NIAGARA 3,498 $339,990,195 $97,196 ONEIDA 3,609 $403,762,375 $111,877 ONONDAGA 9,709 $1,250,304,110 $128,778 ONTARIO 2,513 $292,950,330 $116,574 ORANGE 7,975 $679,015,120 $85,143 ORLEANS 522 $47,195,808 $90,413 OSWEGO 1,485 $111,542,333 $75,113 OTSEGO 878 $73,651,964 $83,886 PUTNAM 2,435 $187,824,754 $77,135 QUEENS 50,829 $3,907,481,340 $76,875 RENSSELAER 2,313 $231,847,850 $100,237 RICHMOND 8,753 $684,400,798 $78,190 ROCKLAND 10,001 $867,823,340 $86,774 SAINT LAWRENCE 1,288 $125,631,911 $97,540 SARATOGA 4,755 $409,751,384 $86,173 SCHENECTADY 2,222 $217,834,564 $98,035 SCHOHARIE 363 $29,000,733 $79,892 SCHUYLER 311 $19,282,761 $62,002 SENECA 493 $46,341,660 $93,999 STEUBEN 1,229 $98,498,456 $80,145 SUFFOLK 42,045 $4,558,501,455 $108,420 SULLIVAN 1,337 $97,512,740 $72,934 TIOGA 552 $41,091,518 $74,441 TOMPKINS 2,135 $185,749,080 $87,002 ULSTER 4,166 $296,431,354 $71,155 WARREN 1,760 $162,104,075 $92,105 WASHINGTON 775 $62,385,200 $80,497 WAYNE 1,417 $113,193,542 $79,883 WESTCHESTER 28,339 $2,836,036,205 $100,075 WYOMING 598 $51,094,649 $85,443 YATES 393 $26,791,404 $68,172 NYS TOTAL 489,106 $50,959,302,727 $104,189 Source: U.S. Small Business Administration
Data accessed on March 25, 2021, for the period ending February 28, 2021.PPP Loans in New York by Firm Size
(as of February 28, 2021)Number of Employees Number of Loans Share of Loans Value of Loans Share of
Loan ValueAverage Loan 0–24 442,851 90.5% $20,236,287,686 39.7% $45,695 25–99 37,026 7.6% $16,037,368,454 31.5% $433,138 100–249 6,810 1.4% $8,164,661,182 16.0% $1,198,922 250–500 2,419 0.5% $6,520,985,405 12.8% $2,695,736 TOTAL 489,106 100% $50,959,302,727 100% $104,189 Source: U.S. Small Business Administration
Data accessed on March 25, 2021, for the period ending February 28, 2021.PPP Loans in New York by Industry
(as of February 28, 2021)Industry / Sector Number of Loans Share of Loans Value of Loans Share of Value Average Loan Professional, Scientific, and Technical Services 70,112 14.3% $7,044,158,918 13.8% $100,470 Health Care and Social Assistance 49,247 10.1% $6,774,903,674 13.3% $137,570 Construction 40,649 8.3% $6,069,393,316 11.9% $149,312 Accommodation and Food Services 44,529 9.1% $5,518,347,641 10.8% $123,927 Manufacturing 19,292 3.9% $3,791,703,594 7.4% $196,543 Retail Trade 48,417 9.9% $3,588,694,869 7.0% $74,121 Other Services (except Public Administration) 51,571 10.5% $3,091,409,069 6.1% $59,945 Wholesale Trade 20,656 4.2% $2,816,830,512 5.5% $136,369 Administrative and Support and Waste Management and Remediation Services 20,054 4.1% $2,471,241,516 4.8% $123,229 Real Estate and Rental and Leasing 22,468 4.6% $1,580,874,345 3.1% $70,361 Educational Services 9,616 2.0% $1,569,741,188 3.1% $163,243 Transportation and Warehousing 24,271 5.0% $1,333,584,827 2.6% $54,946 Information 9,165 1.9% $1,181,579,633 2.3% $128,923 Arts, Entertainment, and Recreation 16,088 3.3% $1,129,338,274 2.2% $70,198 Finance and Insurance 13,147 2.7% $1,041,936,351 2.0% $79,253 Agriculture, Forestry, Fishing and Hunting 3,736 0.8% $275,349,343 0.5% $73,702 Public Administration 1,607 0.3% $178,242,038 0.3% $110,916 Management of Companies and Enterprises 916 0.2% $112,030,694 0.2% $122,304 Mining, Quarrying, and Oil and Gas Extraction 362 0.1% $64,405,797 0.1% $177,917 Utilities 499 0.1% $63,815,161 0.1% $127,886 Unclassified Establishments 22,704 4.6% $1,261,721,967 2.5% $55,573 Total 489,106 100.0% $50,959,302,728 100.0% $104,189 Source: U.S. Small Business Administration
Data accessed on March 25, 2021, for the period ending February 28, 2021.
New York State Enacted Budget for Fiscal Year 2021-22
Last week, New York State leaders adopted a $212 billion budget for the fiscal year beginning April 1, 2021. The budget relies on significant new resources from federal aid and higher tax rates on high-income taxpayers and corporations. Personal income tax rates for filers with incomes of at least $1.1 million will increase from 8.82 percent to as much as 10.9 percent for those with incomes of more than $25 million. The Office of the State Comptroller estimates the change may affect approximately 123,000 filers, more than half of whom were part-time residents or nonresidents in 2019.
The new revenues will support investments in education and health care programs, provide benefits to the middle class, and offer relief to struggling New Yorkers and small businesses. In a press statement, Comptroller DiNapoli cautioned: “While much of the new resources may be temporary and necessary to meet current needs, it is important that spending not grow to unsustainable levels. The State must plan for the end of emergency federal aid and use new tax resources to fund essential services, to once again begin contributing to rainy day funds and to reduce projected out-year gaps.” Read the full statement.
Comptroller DiNapoli will release a detailed analysis of the Enacted Budget shortly.
Prior Editions
- March 30, 2021
- March 18, 2021
- March 4, 2021
- February 18, 2021
- February 3, 2021
- January 21, 2021
- January 7, 2021
- December 16, 2020
- December 2, 2020
- November 12, 2020
- October 28, 2020
- October 14, 2020
- September 30, 2020
- September 16, 2020
- September 2, 2020
- August 19, 2020
- August 5, 2020
- July 22, 2020
- July 9, 2020
Subscribe for Latest Updates
The State Comptroller’s Office is committed to keeping New Yorkers regularly updated on the State’s economy and finances. Subscribe to get the latest update.